Immigrants from Japan vs African Associate's Degree
COMPARE
Immigrants from Japan
African
Associate's Degree
Associate's Degree Comparison
Immigrants from Japan
Africans
54.6%
ASSOCIATE'S DEGREE
100.0/ 100
METRIC RATING
22nd/ 347
METRIC RANK
41.1%
ASSOCIATE'S DEGREE
0.2/ 100
METRIC RATING
265th/ 347
METRIC RANK
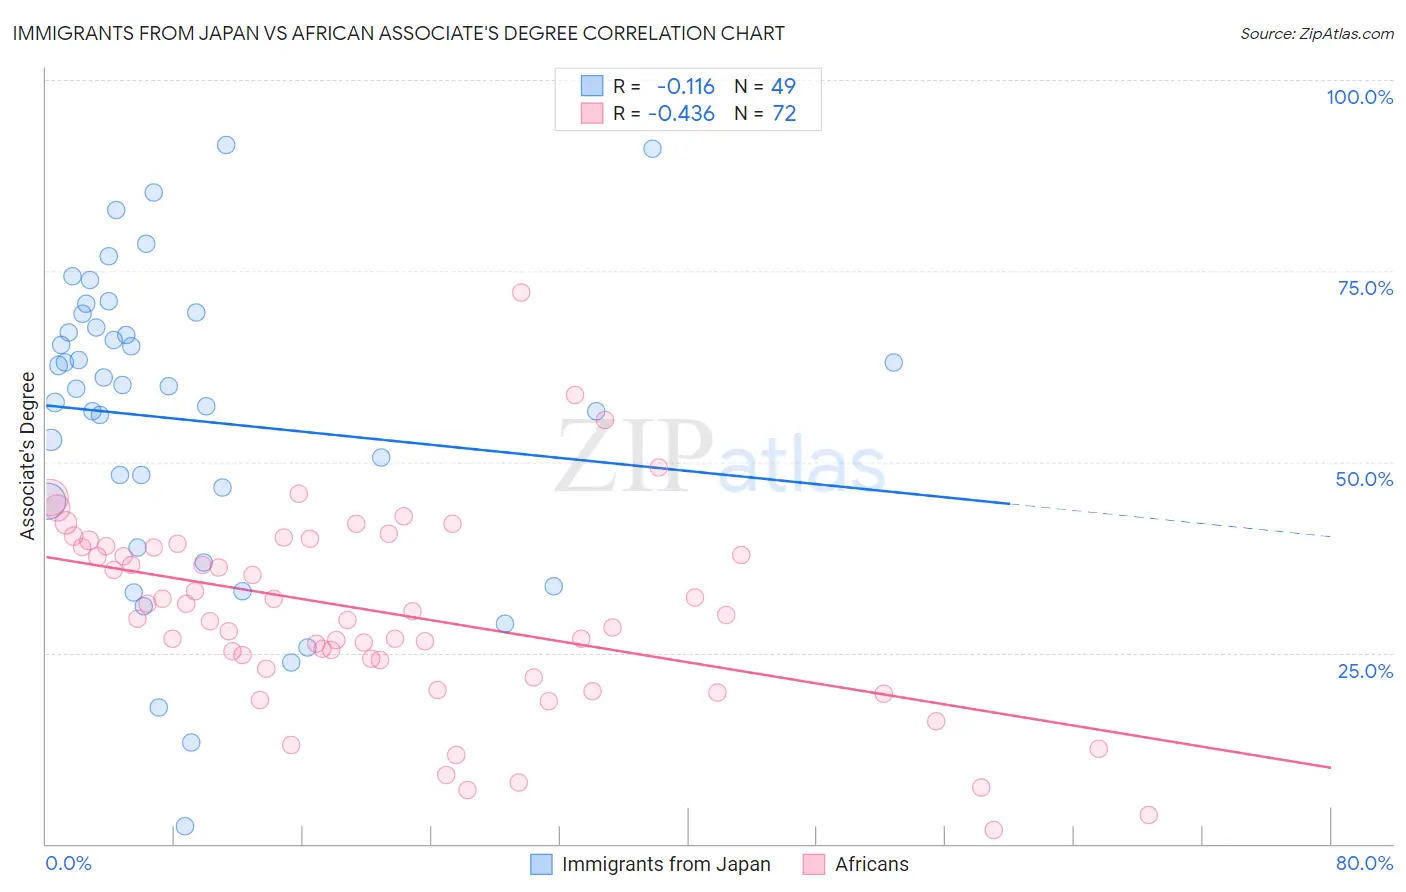
Immigrants from Japan vs African Associate's Degree Correlation Chart
The statistical analysis conducted on geographies consisting of 340,131,347 people shows a poor negative correlation between the proportion of Immigrants from Japan and percentage of population with at least associate's degree education in the United States with a correlation coefficient (R) of -0.116 and weighted average of 54.6%. Similarly, the statistical analysis conducted on geographies consisting of 470,057,267 people shows a moderate negative correlation between the proportion of Africans and percentage of population with at least associate's degree education in the United States with a correlation coefficient (R) of -0.436 and weighted average of 41.1%, a difference of 32.7%.
Associate's Degree Correlation Summary
| Measurement | Immigrants from Japan | African |
| Minimum | 2.2% | 1.7% |
| Maximum | 91.6% | 72.2% |
| Range | 89.3% | 70.5% |
| Mean | 55.5% | 30.2% |
| Median | 60.0% | 29.7% |
| Interquartile 25% (IQ1) | 41.7% | 23.5% |
| Interquartile 75% (IQ3) | 68.5% | 38.9% |
| Interquartile Range (IQR) | 26.8% | 15.4% |
| Standard Deviation (Sample) | 20.1% | 12.9% |
| Standard Deviation (Population) | 19.9% | 12.8% |
Similar Demographics by Associate's Degree
Demographics Similar to Immigrants from Japan by Associate's Degree
In terms of associate's degree, the demographic groups most similar to Immigrants from Japan are Burmese (54.6%, a difference of 0.0%), Immigrants from Sweden (54.6%, a difference of 0.030%), Immigrants from Korea (54.5%, a difference of 0.090%), Cambodian (54.6%, a difference of 0.10%), and Immigrants from Ireland (54.7%, a difference of 0.12%).
| Demographics | Rating | Rank | Associate's Degree |
| Immigrants | Eastern Asia | 100.0 /100 | #15 | Exceptional 55.4% |
| Soviet Union | 100.0 /100 | #16 | Exceptional 55.1% |
| Eastern Europeans | 100.0 /100 | #17 | Exceptional 55.0% |
| Indians (Asian) | 100.0 /100 | #18 | Exceptional 54.8% |
| Immigrants | Ireland | 100.0 /100 | #19 | Exceptional 54.7% |
| Cambodians | 100.0 /100 | #20 | Exceptional 54.6% |
| Immigrants | Sweden | 100.0 /100 | #21 | Exceptional 54.6% |
| Immigrants | Japan | 100.0 /100 | #22 | Exceptional 54.6% |
| Burmese | 100.0 /100 | #23 | Exceptional 54.6% |
| Immigrants | Korea | 100.0 /100 | #24 | Exceptional 54.5% |
| Immigrants | Switzerland | 100.0 /100 | #25 | Exceptional 54.5% |
| Immigrants | Belgium | 100.0 /100 | #26 | Exceptional 54.5% |
| Latvians | 100.0 /100 | #27 | Exceptional 53.9% |
| Turks | 100.0 /100 | #28 | Exceptional 53.9% |
| Immigrants | France | 100.0 /100 | #29 | Exceptional 53.9% |
Demographics Similar to Africans by Associate's Degree
In terms of associate's degree, the demographic groups most similar to Africans are Samoan (41.1%, a difference of 0.0%), Hawaiian (40.9%, a difference of 0.56%), Osage (41.5%, a difference of 0.76%), Central American Indian (40.8%, a difference of 0.76%), and Immigrants from Jamaica (41.5%, a difference of 0.77%).
| Demographics | Rating | Rank | Associate's Degree |
| Japanese | 0.5 /100 | #258 | Tragic 41.7% |
| Malaysians | 0.4 /100 | #259 | Tragic 41.6% |
| Marshallese | 0.4 /100 | #260 | Tragic 41.6% |
| Nicaraguans | 0.4 /100 | #261 | Tragic 41.5% |
| Bahamians | 0.4 /100 | #262 | Tragic 41.5% |
| Immigrants | Jamaica | 0.3 /100 | #263 | Tragic 41.5% |
| Osage | 0.3 /100 | #264 | Tragic 41.5% |
| Africans | 0.2 /100 | #265 | Tragic 41.1% |
| Samoans | 0.2 /100 | #266 | Tragic 41.1% |
| Hawaiians | 0.2 /100 | #267 | Tragic 40.9% |
| Central American Indians | 0.2 /100 | #268 | Tragic 40.8% |
| Americans | 0.2 /100 | #269 | Tragic 40.8% |
| Chippewa | 0.2 /100 | #270 | Tragic 40.7% |
| Immigrants | Laos | 0.1 /100 | #271 | Tragic 40.7% |
| Belizeans | 0.1 /100 | #272 | Tragic 40.6% |