Immigrants from Argentina vs African Associate's Degree
COMPARE
Immigrants from Argentina
African
Associate's Degree
Associate's Degree Comparison
Immigrants from Argentina
Africans
50.9%
ASSOCIATE'S DEGREE
99.5/ 100
METRIC RATING
70th/ 347
METRIC RANK
41.1%
ASSOCIATE'S DEGREE
0.2/ 100
METRIC RATING
265th/ 347
METRIC RANK
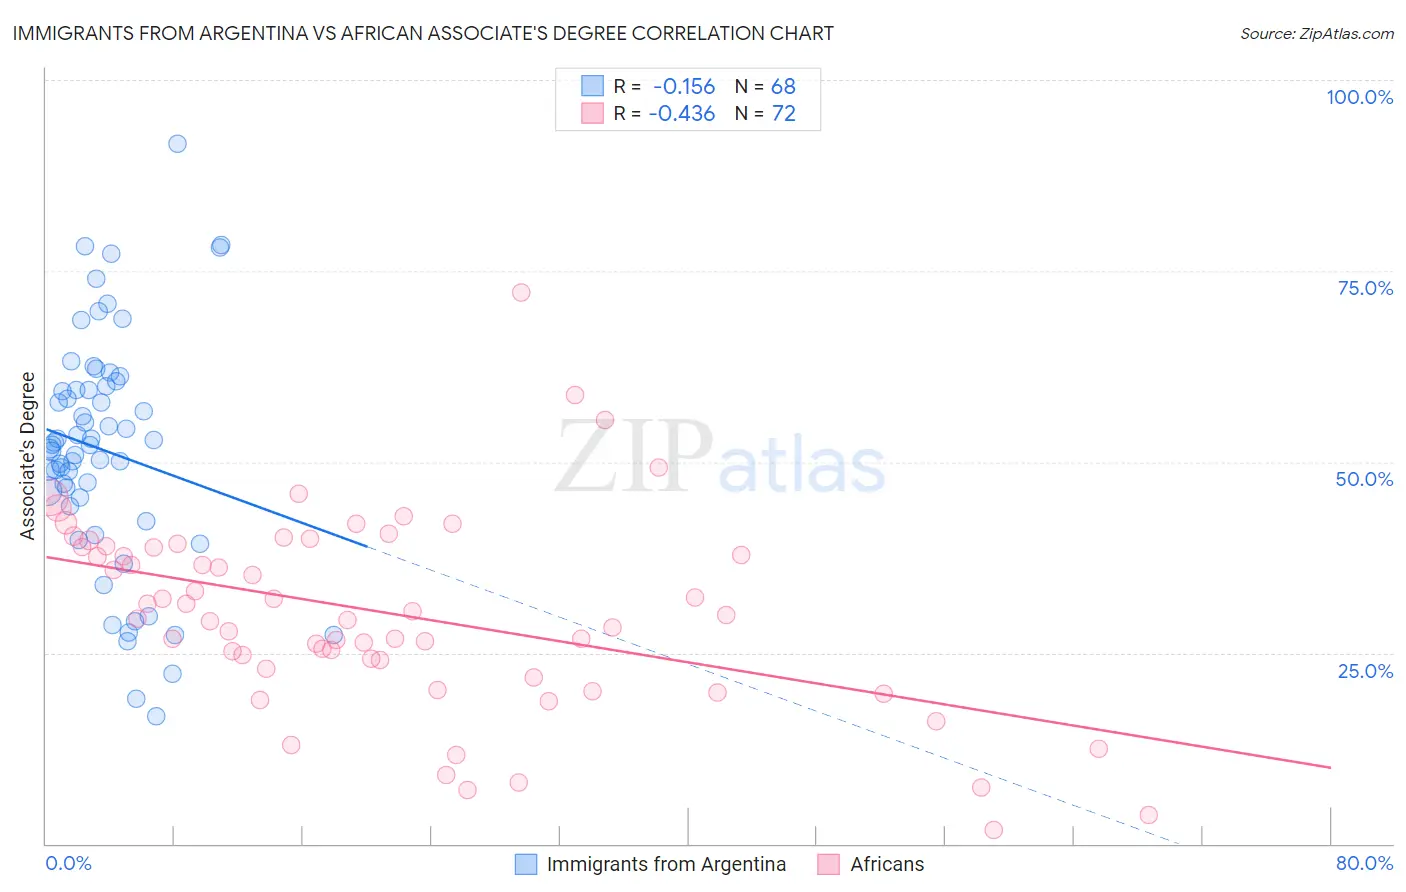
Immigrants from Argentina vs African Associate's Degree Correlation Chart
The statistical analysis conducted on geographies consisting of 264,422,304 people shows a poor negative correlation between the proportion of Immigrants from Argentina and percentage of population with at least associate's degree education in the United States with a correlation coefficient (R) of -0.156 and weighted average of 50.9%. Similarly, the statistical analysis conducted on geographies consisting of 470,057,267 people shows a moderate negative correlation between the proportion of Africans and percentage of population with at least associate's degree education in the United States with a correlation coefficient (R) of -0.436 and weighted average of 41.1%, a difference of 23.8%.
Associate's Degree Correlation Summary
| Measurement | Immigrants from Argentina | African |
| Minimum | 16.7% | 1.7% |
| Maximum | 91.7% | 72.2% |
| Range | 75.0% | 70.5% |
| Mean | 51.4% | 30.2% |
| Median | 52.3% | 29.7% |
| Interquartile 25% (IQ1) | 44.7% | 23.5% |
| Interquartile 75% (IQ3) | 59.7% | 38.9% |
| Interquartile Range (IQR) | 15.0% | 15.4% |
| Standard Deviation (Sample) | 15.2% | 12.9% |
| Standard Deviation (Population) | 15.1% | 12.8% |
Similar Demographics by Associate's Degree
Demographics Similar to Immigrants from Argentina by Associate's Degree
In terms of associate's degree, the demographic groups most similar to Immigrants from Argentina are Immigrants from Romania (50.9%, a difference of 0.010%), Egyptian (50.9%, a difference of 0.030%), Immigrants from Pakistan (50.9%, a difference of 0.070%), Immigrants from Indonesia (51.0%, a difference of 0.15%), and Carpatho Rusyn (50.6%, a difference of 0.54%).
| Demographics | Rating | Rank | Associate's Degree |
| South Africans | 99.7 /100 | #63 | Exceptional 51.4% |
| Immigrants | Netherlands | 99.7 /100 | #64 | Exceptional 51.4% |
| Zimbabweans | 99.7 /100 | #65 | Exceptional 51.3% |
| Immigrants | Europe | 99.7 /100 | #66 | Exceptional 51.3% |
| Argentineans | 99.6 /100 | #67 | Exceptional 51.2% |
| Immigrants | Indonesia | 99.5 /100 | #68 | Exceptional 51.0% |
| Egyptians | 99.5 /100 | #69 | Exceptional 50.9% |
| Immigrants | Argentina | 99.5 /100 | #70 | Exceptional 50.9% |
| Immigrants | Romania | 99.5 /100 | #71 | Exceptional 50.9% |
| Immigrants | Pakistan | 99.5 /100 | #72 | Exceptional 50.9% |
| Carpatho Rusyns | 99.3 /100 | #73 | Exceptional 50.6% |
| Lithuanians | 99.3 /100 | #74 | Exceptional 50.6% |
| Immigrants | Scotland | 99.3 /100 | #75 | Exceptional 50.6% |
| Immigrants | Zimbabwe | 99.2 /100 | #76 | Exceptional 50.5% |
| Immigrants | Lebanon | 99.1 /100 | #77 | Exceptional 50.5% |
Demographics Similar to Africans by Associate's Degree
In terms of associate's degree, the demographic groups most similar to Africans are Samoan (41.1%, a difference of 0.0%), Hawaiian (40.9%, a difference of 0.56%), Osage (41.5%, a difference of 0.76%), Central American Indian (40.8%, a difference of 0.76%), and Immigrants from Jamaica (41.5%, a difference of 0.77%).
| Demographics | Rating | Rank | Associate's Degree |
| Japanese | 0.5 /100 | #258 | Tragic 41.7% |
| Malaysians | 0.4 /100 | #259 | Tragic 41.6% |
| Marshallese | 0.4 /100 | #260 | Tragic 41.6% |
| Nicaraguans | 0.4 /100 | #261 | Tragic 41.5% |
| Bahamians | 0.4 /100 | #262 | Tragic 41.5% |
| Immigrants | Jamaica | 0.3 /100 | #263 | Tragic 41.5% |
| Osage | 0.3 /100 | #264 | Tragic 41.5% |
| Africans | 0.2 /100 | #265 | Tragic 41.1% |
| Samoans | 0.2 /100 | #266 | Tragic 41.1% |
| Hawaiians | 0.2 /100 | #267 | Tragic 40.9% |
| Central American Indians | 0.2 /100 | #268 | Tragic 40.8% |
| Americans | 0.2 /100 | #269 | Tragic 40.8% |
| Chippewa | 0.2 /100 | #270 | Tragic 40.7% |
| Immigrants | Laos | 0.1 /100 | #271 | Tragic 40.7% |
| Belizeans | 0.1 /100 | #272 | Tragic 40.6% |