Immigrants from South Africa vs Chilean Master's Degree
COMPARE
Immigrants from South Africa
Chilean
Master's Degree
Master's Degree Comparison
Immigrants from South Africa
Chileans
18.8%
MASTER'S DEGREE
100.0/ 100
METRIC RATING
51st/ 347
METRIC RANK
16.9%
MASTER'S DEGREE
98.6/ 100
METRIC RATING
102nd/ 347
METRIC RANK
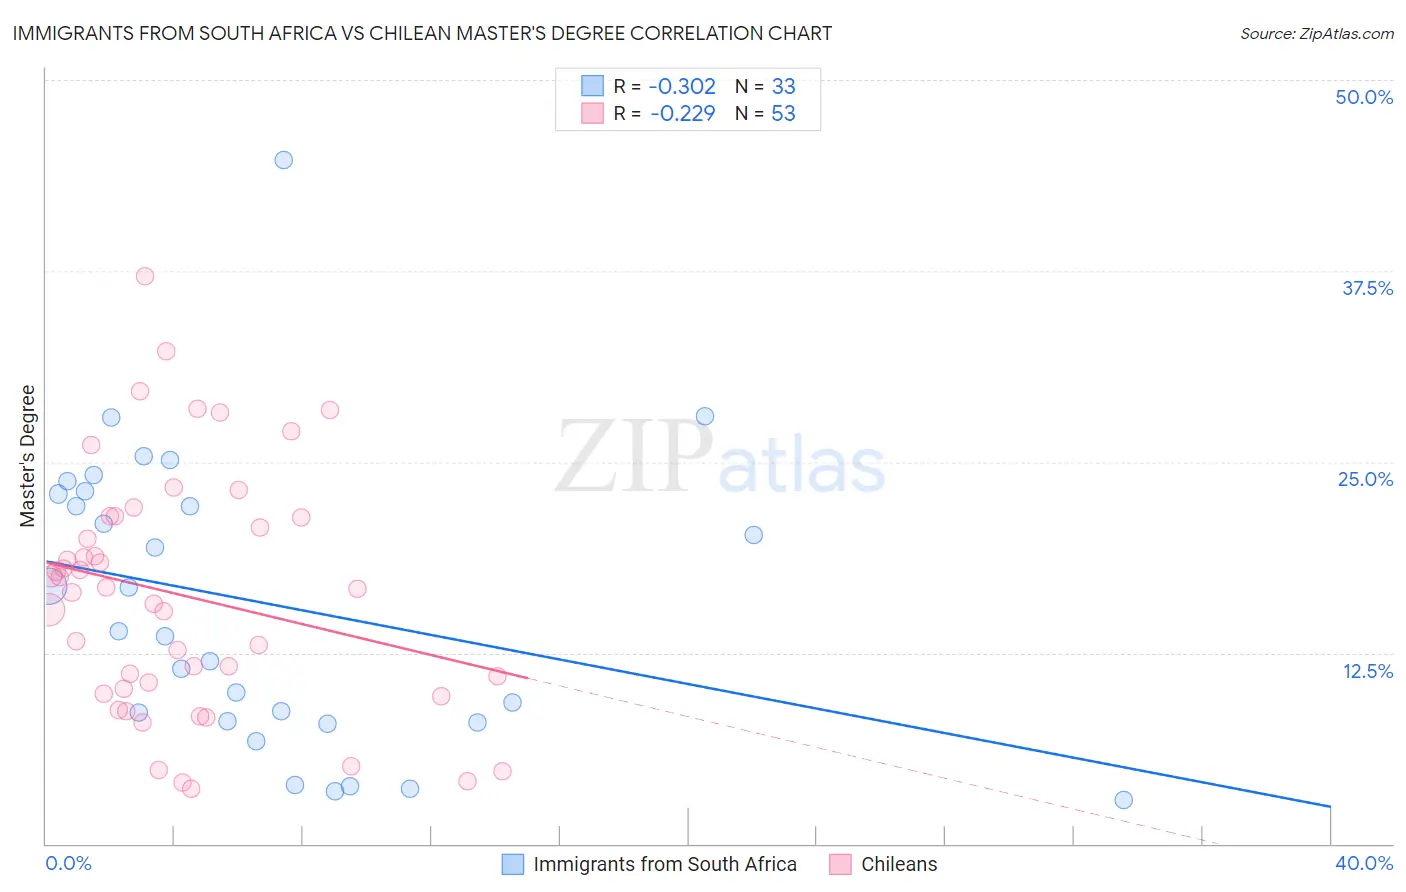
Immigrants from South Africa vs Chilean Master's Degree Correlation Chart
The statistical analysis conducted on geographies consisting of 233,295,718 people shows a mild negative correlation between the proportion of Immigrants from South Africa and percentage of population with at least master's degree education in the United States with a correlation coefficient (R) of -0.302 and weighted average of 18.8%. Similarly, the statistical analysis conducted on geographies consisting of 256,643,247 people shows a weak negative correlation between the proportion of Chileans and percentage of population with at least master's degree education in the United States with a correlation coefficient (R) of -0.229 and weighted average of 16.9%, a difference of 10.7%.
Master's Degree Correlation Summary
| Measurement | Immigrants from South Africa | Chilean |
| Minimum | 2.9% | 3.6% |
| Maximum | 44.8% | 37.2% |
| Range | 41.9% | 33.5% |
| Mean | 15.7% | 16.3% |
| Median | 13.9% | 16.7% |
| Interquartile 25% (IQ1) | 8.0% | 10.0% |
| Interquartile 75% (IQ3) | 23.0% | 21.4% |
| Interquartile Range (IQR) | 15.0% | 11.4% |
| Standard Deviation (Sample) | 9.6% | 7.9% |
| Standard Deviation (Population) | 9.4% | 7.8% |
Similar Demographics by Master's Degree
Demographics Similar to Immigrants from South Africa by Master's Degree
In terms of master's degree, the demographic groups most similar to Immigrants from South Africa are Bulgarian (18.8%, a difference of 0.010%), Estonian (18.8%, a difference of 0.20%), Paraguayan (18.8%, a difference of 0.30%), Immigrants from Austria (18.8%, a difference of 0.35%), and Immigrants from Norway (18.8%, a difference of 0.37%).
| Demographics | Rating | Rank | Master's Degree |
| Immigrants | Malaysia | 100.0 /100 | #44 | Exceptional 18.9% |
| Immigrants | Belarus | 100.0 /100 | #45 | Exceptional 18.9% |
| Immigrants | Norway | 100.0 /100 | #46 | Exceptional 18.8% |
| Immigrants | Austria | 100.0 /100 | #47 | Exceptional 18.8% |
| Paraguayans | 100.0 /100 | #48 | Exceptional 18.8% |
| Estonians | 100.0 /100 | #49 | Exceptional 18.8% |
| Bulgarians | 100.0 /100 | #50 | Exceptional 18.8% |
| Immigrants | South Africa | 100.0 /100 | #51 | Exceptional 18.8% |
| Immigrants | Kuwait | 100.0 /100 | #52 | Exceptional 18.6% |
| Immigrants | Czechoslovakia | 99.9 /100 | #53 | Exceptional 18.5% |
| Immigrants | Lithuania | 99.9 /100 | #54 | Exceptional 18.5% |
| Immigrants | Serbia | 99.9 /100 | #55 | Exceptional 18.5% |
| Asians | 99.9 /100 | #56 | Exceptional 18.4% |
| Immigrants | Asia | 99.9 /100 | #57 | Exceptional 18.4% |
| Australians | 99.9 /100 | #58 | Exceptional 18.4% |
Demographics Similar to Chileans by Master's Degree
In terms of master's degree, the demographic groups most similar to Chileans are Immigrants from Nepal (17.0%, a difference of 0.080%), Albanian (17.0%, a difference of 0.26%), Alsatian (16.9%, a difference of 0.33%), Ukrainian (16.9%, a difference of 0.45%), and Laotian (17.0%, a difference of 0.47%).
| Demographics | Rating | Rank | Master's Degree |
| Immigrants | Morocco | 98.9 /100 | #95 | Exceptional 17.1% |
| Immigrants | Northern Africa | 98.9 /100 | #96 | Exceptional 17.1% |
| Immigrants | England | 98.8 /100 | #97 | Exceptional 17.0% |
| Immigrants | Ukraine | 98.8 /100 | #98 | Exceptional 17.0% |
| Laotians | 98.8 /100 | #99 | Exceptional 17.0% |
| Albanians | 98.7 /100 | #100 | Exceptional 17.0% |
| Immigrants | Nepal | 98.6 /100 | #101 | Exceptional 17.0% |
| Chileans | 98.6 /100 | #102 | Exceptional 16.9% |
| Alsatians | 98.4 /100 | #103 | Exceptional 16.9% |
| Ukrainians | 98.3 /100 | #104 | Exceptional 16.9% |
| Syrians | 98.3 /100 | #105 | Exceptional 16.8% |
| Immigrants | Albania | 98.1 /100 | #106 | Exceptional 16.8% |
| Armenians | 98.0 /100 | #107 | Exceptional 16.8% |
| Sierra Leoneans | 98.0 /100 | #108 | Exceptional 16.8% |
| Moroccans | 98.0 /100 | #109 | Exceptional 16.8% |