Filipino vs Chilean Master's Degree
COMPARE
Filipino
Chilean
Master's Degree
Master's Degree Comparison
Filipinos
Chileans
23.4%
MASTER'S DEGREE
100.0/ 100
METRIC RATING
2nd/ 347
METRIC RANK
16.9%
MASTER'S DEGREE
98.6/ 100
METRIC RATING
102nd/ 347
METRIC RANK
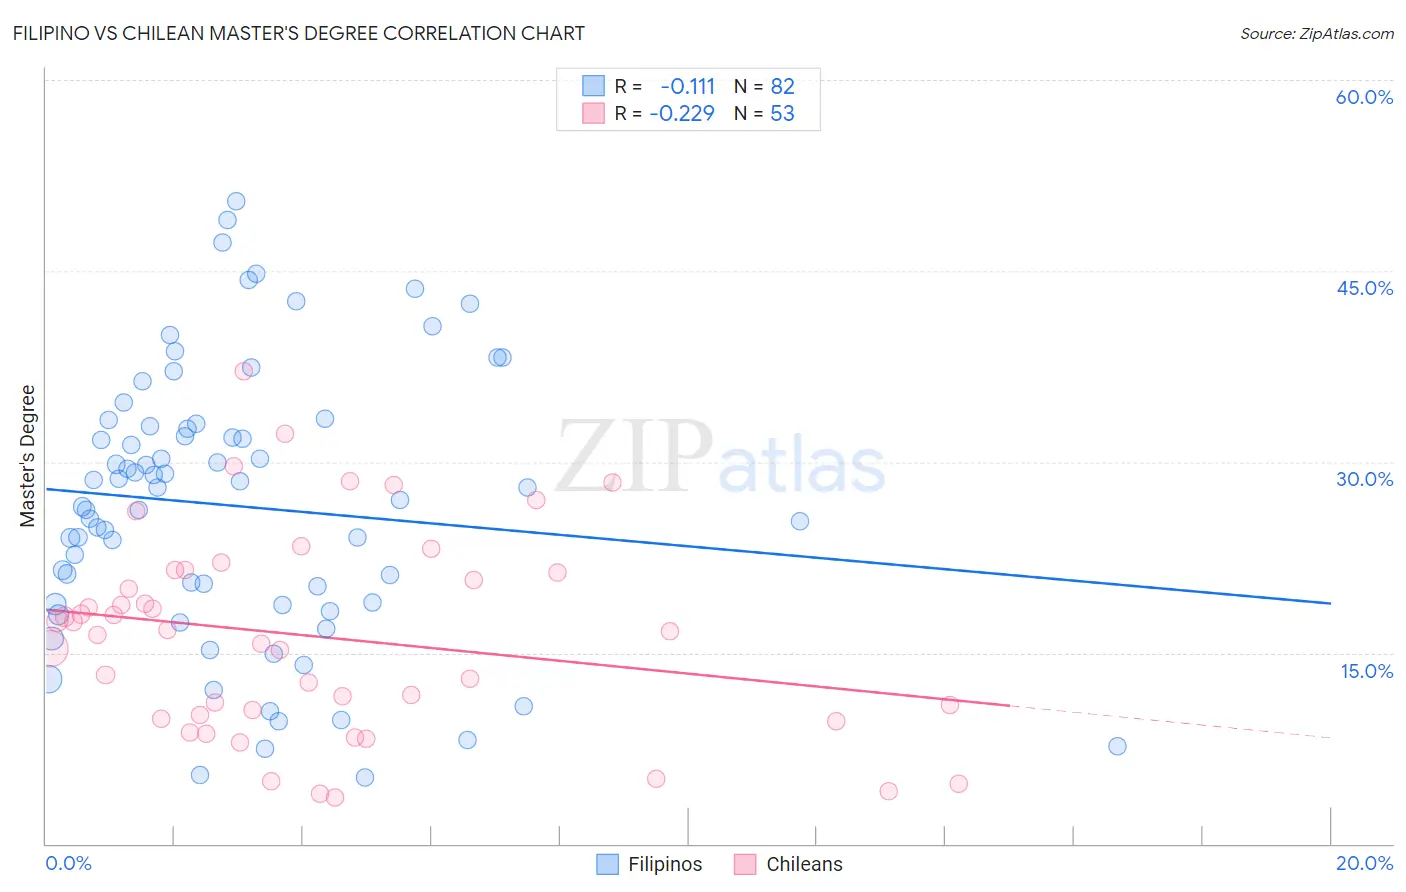
Filipino vs Chilean Master's Degree Correlation Chart
The statistical analysis conducted on geographies consisting of 254,302,816 people shows a poor negative correlation between the proportion of Filipinos and percentage of population with at least master's degree education in the United States with a correlation coefficient (R) of -0.111 and weighted average of 23.4%. Similarly, the statistical analysis conducted on geographies consisting of 256,643,247 people shows a weak negative correlation between the proportion of Chileans and percentage of population with at least master's degree education in the United States with a correlation coefficient (R) of -0.229 and weighted average of 16.9%, a difference of 38.2%.
Master's Degree Correlation Summary
| Measurement | Filipino | Chilean |
| Minimum | 5.2% | 3.6% |
| Maximum | 50.5% | 37.2% |
| Range | 45.2% | 33.5% |
| Mean | 26.5% | 16.3% |
| Median | 27.5% | 16.7% |
| Interquartile 25% (IQ1) | 18.8% | 10.0% |
| Interquartile 75% (IQ3) | 32.8% | 21.4% |
| Interquartile Range (IQR) | 14.0% | 11.4% |
| Standard Deviation (Sample) | 10.7% | 7.9% |
| Standard Deviation (Population) | 10.6% | 7.8% |
Similar Demographics by Master's Degree
Demographics Similar to Filipinos by Master's Degree
In terms of master's degree, the demographic groups most similar to Filipinos are Immigrants from Singapore (23.4%, a difference of 0.050%), Immigrants from Israel (22.6%, a difference of 3.4%), Okinawan (22.6%, a difference of 3.4%), Immigrants from Taiwan (22.5%, a difference of 4.2%), and Immigrants from India (22.3%, a difference of 4.9%).
| Demographics | Rating | Rank | Master's Degree |
| Immigrants | Singapore | 100.0 /100 | #1 | Exceptional 23.4% |
| Filipinos | 100.0 /100 | #2 | Exceptional 23.4% |
| Immigrants | Israel | 100.0 /100 | #3 | Exceptional 22.6% |
| Okinawans | 100.0 /100 | #4 | Exceptional 22.6% |
| Immigrants | Taiwan | 100.0 /100 | #5 | Exceptional 22.5% |
| Immigrants | India | 100.0 /100 | #6 | Exceptional 22.3% |
| Iranians | 100.0 /100 | #7 | Exceptional 22.3% |
| Cypriots | 100.0 /100 | #8 | Exceptional 21.8% |
| Thais | 100.0 /100 | #9 | Exceptional 21.7% |
| Immigrants | Iran | 100.0 /100 | #10 | Exceptional 21.6% |
| Immigrants | China | 100.0 /100 | #11 | Exceptional 21.2% |
| Eastern Europeans | 100.0 /100 | #12 | Exceptional 21.1% |
| Immigrants | Australia | 100.0 /100 | #13 | Exceptional 20.9% |
| Immigrants | Switzerland | 100.0 /100 | #14 | Exceptional 20.9% |
| Immigrants | Eastern Asia | 100.0 /100 | #15 | Exceptional 20.8% |
Demographics Similar to Chileans by Master's Degree
In terms of master's degree, the demographic groups most similar to Chileans are Immigrants from Nepal (17.0%, a difference of 0.080%), Albanian (17.0%, a difference of 0.26%), Alsatian (16.9%, a difference of 0.33%), Ukrainian (16.9%, a difference of 0.45%), and Laotian (17.0%, a difference of 0.47%).
| Demographics | Rating | Rank | Master's Degree |
| Immigrants | Morocco | 98.9 /100 | #95 | Exceptional 17.1% |
| Immigrants | Northern Africa | 98.9 /100 | #96 | Exceptional 17.1% |
| Immigrants | England | 98.8 /100 | #97 | Exceptional 17.0% |
| Immigrants | Ukraine | 98.8 /100 | #98 | Exceptional 17.0% |
| Laotians | 98.8 /100 | #99 | Exceptional 17.0% |
| Albanians | 98.7 /100 | #100 | Exceptional 17.0% |
| Immigrants | Nepal | 98.6 /100 | #101 | Exceptional 17.0% |
| Chileans | 98.6 /100 | #102 | Exceptional 16.9% |
| Alsatians | 98.4 /100 | #103 | Exceptional 16.9% |
| Ukrainians | 98.3 /100 | #104 | Exceptional 16.9% |
| Syrians | 98.3 /100 | #105 | Exceptional 16.8% |
| Immigrants | Albania | 98.1 /100 | #106 | Exceptional 16.8% |
| Armenians | 98.0 /100 | #107 | Exceptional 16.8% |
| Sierra Leoneans | 98.0 /100 | #108 | Exceptional 16.8% |
| Moroccans | 98.0 /100 | #109 | Exceptional 16.8% |