Immigrants from South Africa vs Taiwanese Master's Degree
COMPARE
Immigrants from South Africa
Taiwanese
Master's Degree
Master's Degree Comparison
Immigrants from South Africa
Taiwanese
18.8%
MASTER'S DEGREE
100.0/ 100
METRIC RATING
51st/ 347
METRIC RANK
16.1%
MASTER'S DEGREE
91.9/ 100
METRIC RATING
131st/ 347
METRIC RANK
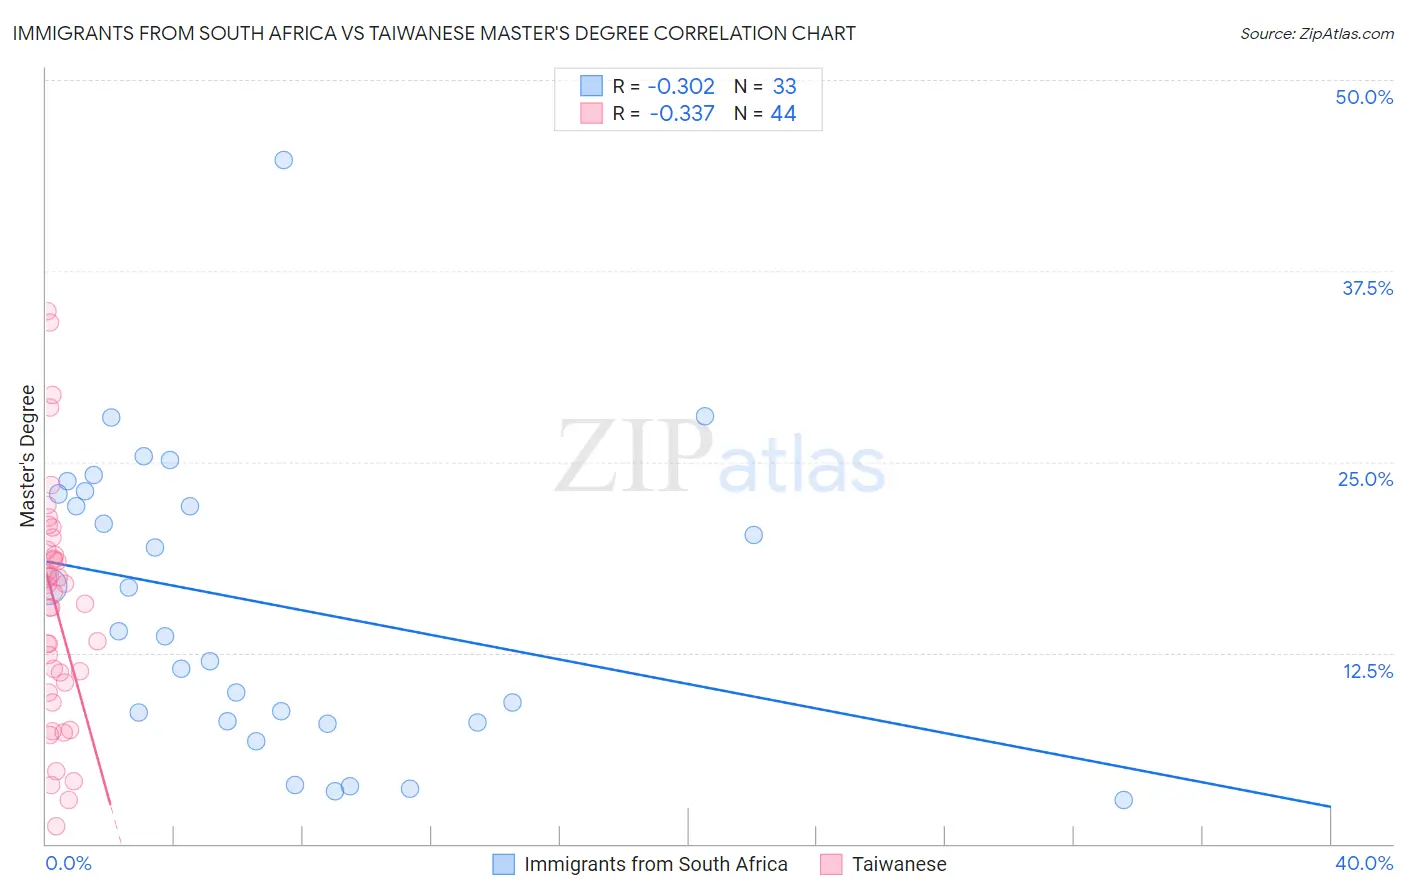
Immigrants from South Africa vs Taiwanese Master's Degree Correlation Chart
The statistical analysis conducted on geographies consisting of 233,295,718 people shows a mild negative correlation between the proportion of Immigrants from South Africa and percentage of population with at least master's degree education in the United States with a correlation coefficient (R) of -0.302 and weighted average of 18.8%. Similarly, the statistical analysis conducted on geographies consisting of 31,724,936 people shows a mild negative correlation between the proportion of Taiwanese and percentage of population with at least master's degree education in the United States with a correlation coefficient (R) of -0.337 and weighted average of 16.1%, a difference of 16.6%.
Master's Degree Correlation Summary
| Measurement | Immigrants from South Africa | Taiwanese |
| Minimum | 2.9% | 1.1% |
| Maximum | 44.8% | 34.9% |
| Range | 41.9% | 33.8% |
| Mean | 15.7% | 15.4% |
| Median | 13.9% | 16.1% |
| Interquartile 25% (IQ1) | 8.0% | 10.2% |
| Interquartile 75% (IQ3) | 23.0% | 19.0% |
| Interquartile Range (IQR) | 15.0% | 8.8% |
| Standard Deviation (Sample) | 9.6% | 7.7% |
| Standard Deviation (Population) | 9.4% | 7.6% |
Similar Demographics by Master's Degree
Demographics Similar to Immigrants from South Africa by Master's Degree
In terms of master's degree, the demographic groups most similar to Immigrants from South Africa are Bulgarian (18.8%, a difference of 0.010%), Estonian (18.8%, a difference of 0.20%), Paraguayan (18.8%, a difference of 0.30%), Immigrants from Austria (18.8%, a difference of 0.35%), and Immigrants from Norway (18.8%, a difference of 0.37%).
| Demographics | Rating | Rank | Master's Degree |
| Immigrants | Malaysia | 100.0 /100 | #44 | Exceptional 18.9% |
| Immigrants | Belarus | 100.0 /100 | #45 | Exceptional 18.9% |
| Immigrants | Norway | 100.0 /100 | #46 | Exceptional 18.8% |
| Immigrants | Austria | 100.0 /100 | #47 | Exceptional 18.8% |
| Paraguayans | 100.0 /100 | #48 | Exceptional 18.8% |
| Estonians | 100.0 /100 | #49 | Exceptional 18.8% |
| Bulgarians | 100.0 /100 | #50 | Exceptional 18.8% |
| Immigrants | South Africa | 100.0 /100 | #51 | Exceptional 18.8% |
| Immigrants | Kuwait | 100.0 /100 | #52 | Exceptional 18.6% |
| Immigrants | Czechoslovakia | 99.9 /100 | #53 | Exceptional 18.5% |
| Immigrants | Lithuania | 99.9 /100 | #54 | Exceptional 18.5% |
| Immigrants | Serbia | 99.9 /100 | #55 | Exceptional 18.5% |
| Asians | 99.9 /100 | #56 | Exceptional 18.4% |
| Immigrants | Asia | 99.9 /100 | #57 | Exceptional 18.4% |
| Australians | 99.9 /100 | #58 | Exceptional 18.4% |
Demographics Similar to Taiwanese by Master's Degree
In terms of master's degree, the demographic groups most similar to Taiwanese are Serbian (16.1%, a difference of 0.090%), Immigrants from Jordan (16.1%, a difference of 0.32%), Immigrants from Syria (16.2%, a difference of 0.58%), Immigrants from Sudan (16.0%, a difference of 0.63%), and Venezuelan (15.9%, a difference of 1.2%).
| Demographics | Rating | Rank | Master's Degree |
| Immigrants | Eritrea | 95.5 /100 | #124 | Exceptional 16.4% |
| Italians | 95.4 /100 | #125 | Exceptional 16.4% |
| Immigrants | Eastern Africa | 95.2 /100 | #126 | Exceptional 16.3% |
| Palestinians | 94.8 /100 | #127 | Exceptional 16.3% |
| Immigrants | Sierra Leone | 94.7 /100 | #128 | Exceptional 16.3% |
| Immigrants | Syria | 93.3 /100 | #129 | Exceptional 16.2% |
| Immigrants | Jordan | 92.7 /100 | #130 | Exceptional 16.1% |
| Taiwanese | 91.9 /100 | #131 | Exceptional 16.1% |
| Serbians | 91.7 /100 | #132 | Exceptional 16.1% |
| Immigrants | Sudan | 90.2 /100 | #133 | Exceptional 16.0% |
| Venezuelans | 88.4 /100 | #134 | Excellent 15.9% |
| South American Indians | 88.4 /100 | #135 | Excellent 15.9% |
| Assyrians/Chaldeans/Syriacs | 86.8 /100 | #136 | Excellent 15.8% |
| Europeans | 86.4 /100 | #137 | Excellent 15.8% |
| Pakistanis | 86.1 /100 | #138 | Excellent 15.8% |