Immigrants from South Africa vs Nepalese Master's Degree
COMPARE
Immigrants from South Africa
Nepalese
Master's Degree
Master's Degree Comparison
Immigrants from South Africa
Nepalese
18.8%
MASTER'S DEGREE
100.0/ 100
METRIC RATING
51st/ 347
METRIC RANK
10.5%
MASTER'S DEGREE
0.0/ 100
METRIC RATING
329th/ 347
METRIC RANK
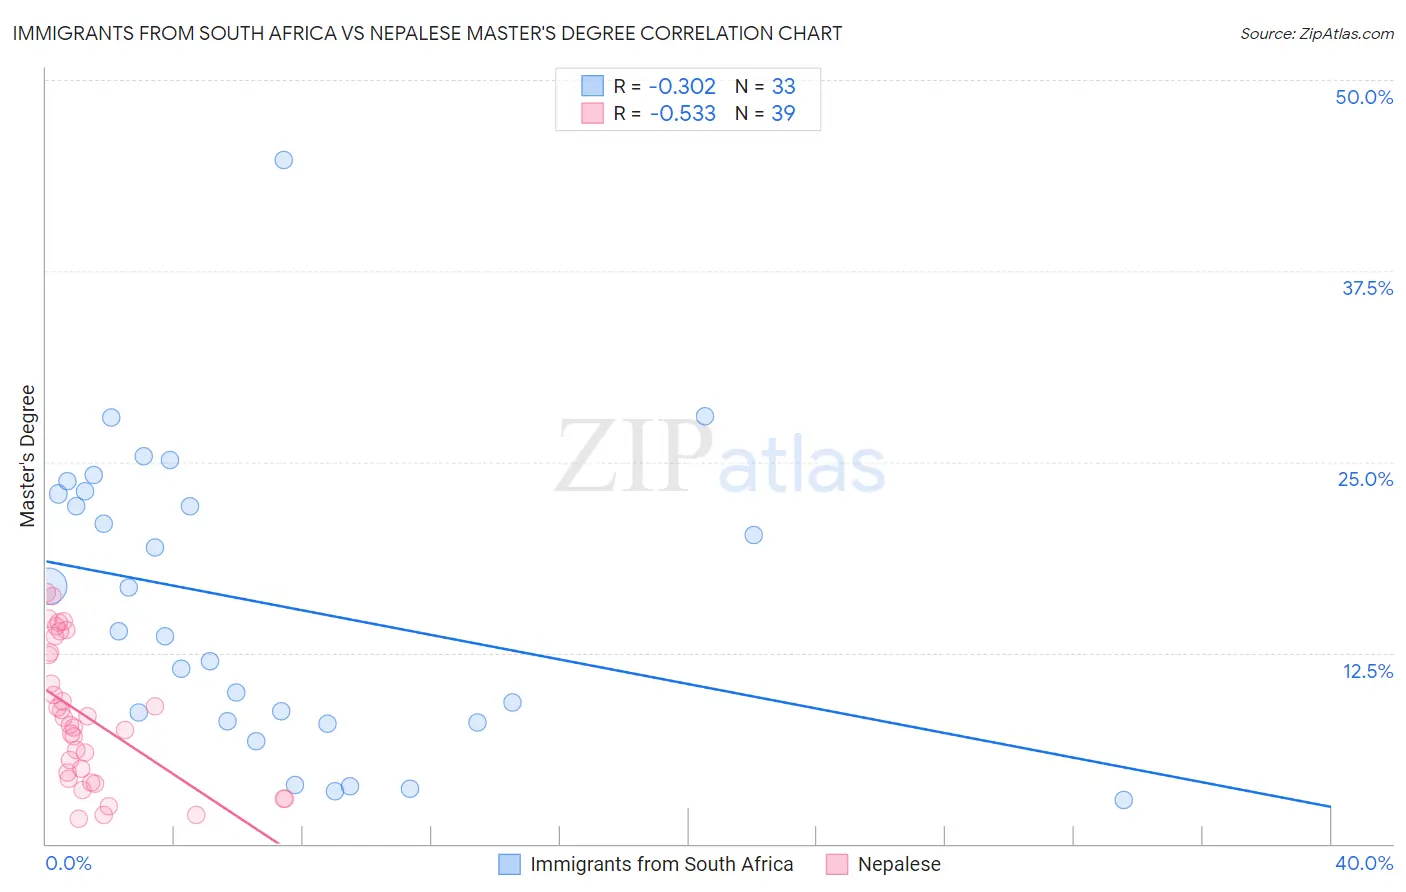
Immigrants from South Africa vs Nepalese Master's Degree Correlation Chart
The statistical analysis conducted on geographies consisting of 233,295,718 people shows a mild negative correlation between the proportion of Immigrants from South Africa and percentage of population with at least master's degree education in the United States with a correlation coefficient (R) of -0.302 and weighted average of 18.8%. Similarly, the statistical analysis conducted on geographies consisting of 24,519,269 people shows a substantial negative correlation between the proportion of Nepalese and percentage of population with at least master's degree education in the United States with a correlation coefficient (R) of -0.533 and weighted average of 10.5%, a difference of 79.1%.
Master's Degree Correlation Summary
| Measurement | Immigrants from South Africa | Nepalese |
| Minimum | 2.9% | 1.7% |
| Maximum | 44.8% | 16.5% |
| Range | 41.9% | 14.8% |
| Mean | 15.7% | 8.3% |
| Median | 13.9% | 7.8% |
| Interquartile 25% (IQ1) | 8.0% | 4.2% |
| Interquartile 75% (IQ3) | 23.0% | 12.5% |
| Interquartile Range (IQR) | 15.0% | 8.3% |
| Standard Deviation (Sample) | 9.6% | 4.5% |
| Standard Deviation (Population) | 9.4% | 4.4% |
Similar Demographics by Master's Degree
Demographics Similar to Immigrants from South Africa by Master's Degree
In terms of master's degree, the demographic groups most similar to Immigrants from South Africa are Bulgarian (18.8%, a difference of 0.010%), Estonian (18.8%, a difference of 0.20%), Paraguayan (18.8%, a difference of 0.30%), Immigrants from Austria (18.8%, a difference of 0.35%), and Immigrants from Norway (18.8%, a difference of 0.37%).
| Demographics | Rating | Rank | Master's Degree |
| Immigrants | Malaysia | 100.0 /100 | #44 | Exceptional 18.9% |
| Immigrants | Belarus | 100.0 /100 | #45 | Exceptional 18.9% |
| Immigrants | Norway | 100.0 /100 | #46 | Exceptional 18.8% |
| Immigrants | Austria | 100.0 /100 | #47 | Exceptional 18.8% |
| Paraguayans | 100.0 /100 | #48 | Exceptional 18.8% |
| Estonians | 100.0 /100 | #49 | Exceptional 18.8% |
| Bulgarians | 100.0 /100 | #50 | Exceptional 18.8% |
| Immigrants | South Africa | 100.0 /100 | #51 | Exceptional 18.8% |
| Immigrants | Kuwait | 100.0 /100 | #52 | Exceptional 18.6% |
| Immigrants | Czechoslovakia | 99.9 /100 | #53 | Exceptional 18.5% |
| Immigrants | Lithuania | 99.9 /100 | #54 | Exceptional 18.5% |
| Immigrants | Serbia | 99.9 /100 | #55 | Exceptional 18.5% |
| Asians | 99.9 /100 | #56 | Exceptional 18.4% |
| Immigrants | Asia | 99.9 /100 | #57 | Exceptional 18.4% |
| Australians | 99.9 /100 | #58 | Exceptional 18.4% |
Demographics Similar to Nepalese by Master's Degree
In terms of master's degree, the demographic groups most similar to Nepalese are Bangladeshi (10.5%, a difference of 0.080%), Paiute (10.5%, a difference of 0.21%), Inupiat (10.5%, a difference of 0.40%), Creek (10.5%, a difference of 0.40%), and Dutch West Indian (10.6%, a difference of 1.5%).
| Demographics | Rating | Rank | Master's Degree |
| Sioux | 0.0 /100 | #322 | Tragic 10.7% |
| Crow | 0.0 /100 | #323 | Tragic 10.6% |
| Dutch West Indians | 0.0 /100 | #324 | Tragic 10.6% |
| Inupiat | 0.0 /100 | #325 | Tragic 10.5% |
| Creek | 0.0 /100 | #326 | Tragic 10.5% |
| Paiute | 0.0 /100 | #327 | Tragic 10.5% |
| Bangladeshis | 0.0 /100 | #328 | Tragic 10.5% |
| Nepalese | 0.0 /100 | #329 | Tragic 10.5% |
| Fijians | 0.0 /100 | #330 | Tragic 10.3% |
| Pueblo | 0.0 /100 | #331 | Tragic 10.3% |
| Immigrants | Azores | 0.0 /100 | #332 | Tragic 10.2% |
| Menominee | 0.0 /100 | #333 | Tragic 10.2% |
| Arapaho | 0.0 /100 | #334 | Tragic 10.0% |
| Immigrants | Central America | 0.0 /100 | #335 | Tragic 10.0% |
| Natives/Alaskans | 0.0 /100 | #336 | Tragic 9.9% |