Carpatho Rusyn vs Chilean Master's Degree
COMPARE
Carpatho Rusyn
Chilean
Master's Degree
Master's Degree Comparison
Carpatho Rusyns
Chileans
17.5%
MASTER'S DEGREE
99.6/ 100
METRIC RATING
80th/ 347
METRIC RANK
16.9%
MASTER'S DEGREE
98.6/ 100
METRIC RATING
102nd/ 347
METRIC RANK
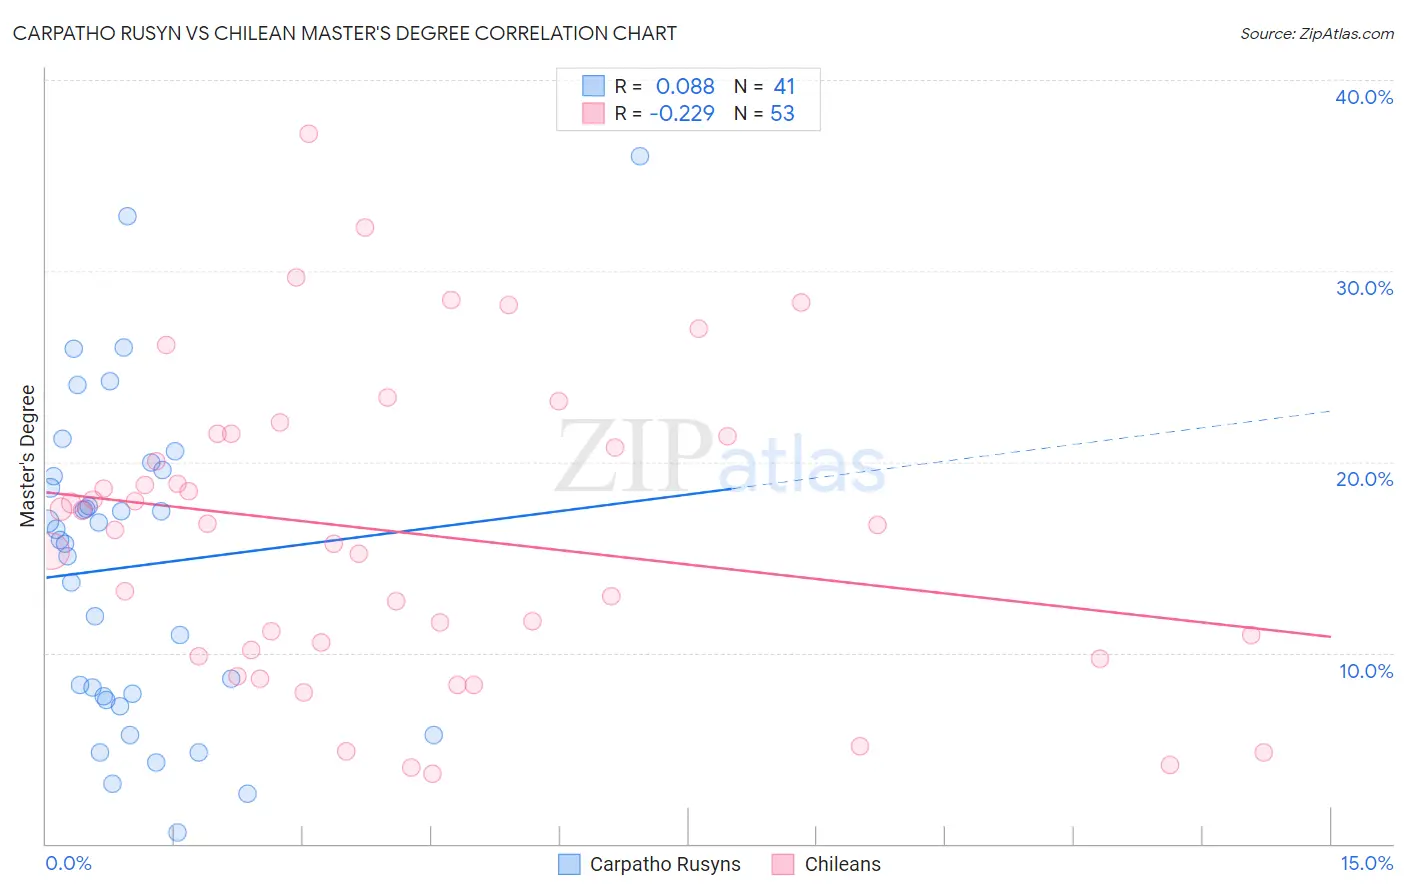
Carpatho Rusyn vs Chilean Master's Degree Correlation Chart
The statistical analysis conducted on geographies consisting of 58,870,133 people shows a slight positive correlation between the proportion of Carpatho Rusyns and percentage of population with at least master's degree education in the United States with a correlation coefficient (R) of 0.088 and weighted average of 17.5%. Similarly, the statistical analysis conducted on geographies consisting of 256,643,247 people shows a weak negative correlation between the proportion of Chileans and percentage of population with at least master's degree education in the United States with a correlation coefficient (R) of -0.229 and weighted average of 16.9%, a difference of 3.4%.
Master's Degree Correlation Summary
| Measurement | Carpatho Rusyn | Chilean |
| Minimum | 0.58% | 3.6% |
| Maximum | 36.0% | 37.2% |
| Range | 35.4% | 33.5% |
| Mean | 14.5% | 16.3% |
| Median | 15.9% | 16.7% |
| Interquartile 25% (IQ1) | 7.6% | 10.0% |
| Interquartile 75% (IQ3) | 19.4% | 21.4% |
| Interquartile Range (IQR) | 11.8% | 11.4% |
| Standard Deviation (Sample) | 8.3% | 7.9% |
| Standard Deviation (Population) | 8.2% | 7.8% |
Similar Demographics by Master's Degree
Demographics Similar to Carpatho Rusyns by Master's Degree
In terms of master's degree, the demographic groups most similar to Carpatho Rusyns are Immigrants from Lebanon (17.5%, a difference of 0.050%), Immigrants from Hungary (17.5%, a difference of 0.19%), Immigrants from Western Asia (17.5%, a difference of 0.30%), Greek (17.5%, a difference of 0.35%), and Immigrants from Eastern Europe (17.6%, a difference of 0.38%).
| Demographics | Rating | Rank | Master's Degree |
| Zimbabweans | 99.7 /100 | #73 | Exceptional 17.7% |
| Immigrants | Romania | 99.7 /100 | #74 | Exceptional 17.7% |
| Egyptians | 99.6 /100 | #75 | Exceptional 17.6% |
| Immigrants | Indonesia | 99.6 /100 | #76 | Exceptional 17.6% |
| Immigrants | Eastern Europe | 99.6 /100 | #77 | Exceptional 17.6% |
| Immigrants | Hungary | 99.6 /100 | #78 | Exceptional 17.5% |
| Immigrants | Lebanon | 99.6 /100 | #79 | Exceptional 17.5% |
| Carpatho Rusyns | 99.6 /100 | #80 | Exceptional 17.5% |
| Immigrants | Western Asia | 99.5 /100 | #81 | Exceptional 17.5% |
| Greeks | 99.5 /100 | #82 | Exceptional 17.5% |
| Immigrants | Zimbabwe | 99.5 /100 | #83 | Exceptional 17.4% |
| Immigrants | Scotland | 99.4 /100 | #84 | Exceptional 17.4% |
| Immigrants | Brazil | 99.4 /100 | #85 | Exceptional 17.4% |
| Immigrants | Croatia | 99.3 /100 | #86 | Exceptional 17.3% |
| Maltese | 99.3 /100 | #87 | Exceptional 17.3% |
Demographics Similar to Chileans by Master's Degree
In terms of master's degree, the demographic groups most similar to Chileans are Immigrants from Nepal (17.0%, a difference of 0.080%), Albanian (17.0%, a difference of 0.26%), Alsatian (16.9%, a difference of 0.33%), Ukrainian (16.9%, a difference of 0.45%), and Laotian (17.0%, a difference of 0.47%).
| Demographics | Rating | Rank | Master's Degree |
| Immigrants | Morocco | 98.9 /100 | #95 | Exceptional 17.1% |
| Immigrants | Northern Africa | 98.9 /100 | #96 | Exceptional 17.1% |
| Immigrants | England | 98.8 /100 | #97 | Exceptional 17.0% |
| Immigrants | Ukraine | 98.8 /100 | #98 | Exceptional 17.0% |
| Laotians | 98.8 /100 | #99 | Exceptional 17.0% |
| Albanians | 98.7 /100 | #100 | Exceptional 17.0% |
| Immigrants | Nepal | 98.6 /100 | #101 | Exceptional 17.0% |
| Chileans | 98.6 /100 | #102 | Exceptional 16.9% |
| Alsatians | 98.4 /100 | #103 | Exceptional 16.9% |
| Ukrainians | 98.3 /100 | #104 | Exceptional 16.9% |
| Syrians | 98.3 /100 | #105 | Exceptional 16.8% |
| Immigrants | Albania | 98.1 /100 | #106 | Exceptional 16.8% |
| Armenians | 98.0 /100 | #107 | Exceptional 16.8% |
| Sierra Leoneans | 98.0 /100 | #108 | Exceptional 16.8% |
| Moroccans | 98.0 /100 | #109 | Exceptional 16.8% |