Immigrants from Somalia vs Immigrants from Lebanon No Schooling Completed
COMPARE
Immigrants from Somalia
Immigrants from Lebanon
No Schooling Completed
No Schooling Completed Comparison
Immigrants from Somalia
Immigrants from Lebanon
3.0%
NO SCHOOLING COMPLETED
0.0/ 100
METRIC RATING
308th/ 347
METRIC RANK
2.3%
NO SCHOOLING COMPLETED
4.5/ 100
METRIC RATING
223rd/ 347
METRIC RANK
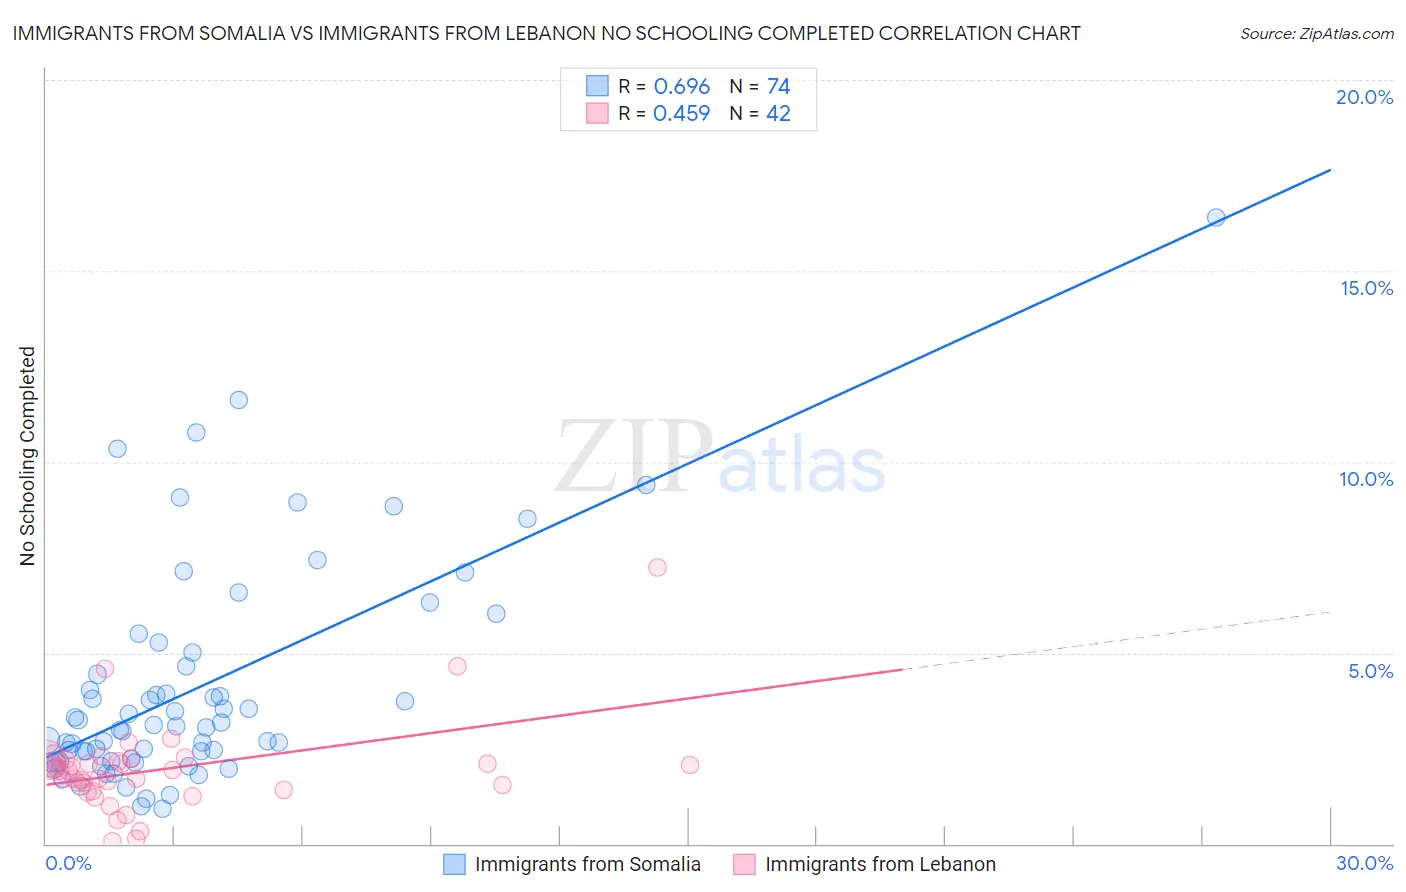
Immigrants from Somalia vs Immigrants from Lebanon No Schooling Completed Correlation Chart
The statistical analysis conducted on geographies consisting of 92,035,757 people shows a significant positive correlation between the proportion of Immigrants from Somalia and percentage of population with no schooling in the United States with a correlation coefficient (R) of 0.696 and weighted average of 3.0%. Similarly, the statistical analysis conducted on geographies consisting of 216,259,293 people shows a moderate positive correlation between the proportion of Immigrants from Lebanon and percentage of population with no schooling in the United States with a correlation coefficient (R) of 0.459 and weighted average of 2.3%, a difference of 30.6%.
No Schooling Completed Correlation Summary
| Measurement | Immigrants from Somalia | Immigrants from Lebanon |
| Minimum | 0.92% | 0.079% |
| Maximum | 16.4% | 7.2% |
| Range | 15.5% | 7.2% |
| Mean | 4.1% | 2.0% |
| Median | 3.0% | 1.9% |
| Interquartile 25% (IQ1) | 2.2% | 1.4% |
| Interquartile 75% (IQ3) | 4.6% | 2.2% |
| Interquartile Range (IQR) | 2.5% | 0.77% |
| Standard Deviation (Sample) | 2.9% | 1.2% |
| Standard Deviation (Population) | 2.9% | 1.2% |
Similar Demographics by No Schooling Completed
Demographics Similar to Immigrants from Somalia by No Schooling Completed
In terms of no schooling completed, the demographic groups most similar to Immigrants from Somalia are Immigrants from Haiti (3.0%, a difference of 0.16%), Belizean (3.0%, a difference of 0.24%), Hispanic or Latino (3.0%, a difference of 0.81%), Guyanese (3.0%, a difference of 0.86%), and Immigrants from the Azores (3.0%, a difference of 0.96%).
| Demographics | Rating | Rank | No Schooling Completed |
| Immigrants | South Eastern Asia | 0.0 /100 | #301 | Tragic 2.9% |
| Immigrants | Caribbean | 0.0 /100 | #302 | Tragic 2.9% |
| Somalis | 0.0 /100 | #303 | Tragic 2.9% |
| Nicaraguans | 0.0 /100 | #304 | Tragic 2.9% |
| Ecuadorians | 0.0 /100 | #305 | Tragic 3.0% |
| Belizeans | 0.0 /100 | #306 | Tragic 3.0% |
| Immigrants | Haiti | 0.0 /100 | #307 | Tragic 3.0% |
| Immigrants | Somalia | 0.0 /100 | #308 | Tragic 3.0% |
| Hispanics or Latinos | 0.0 /100 | #309 | Tragic 3.0% |
| Guyanese | 0.0 /100 | #310 | Tragic 3.0% |
| Immigrants | Azores | 0.0 /100 | #311 | Tragic 3.0% |
| Sri Lankans | 0.0 /100 | #312 | Tragic 3.0% |
| Hondurans | 0.0 /100 | #313 | Tragic 3.1% |
| Immigrants | Belize | 0.0 /100 | #314 | Tragic 3.1% |
| Immigrants | Nicaragua | 0.0 /100 | #315 | Tragic 3.1% |
Demographics Similar to Immigrants from Lebanon by No Schooling Completed
In terms of no schooling completed, the demographic groups most similar to Immigrants from Lebanon are Subsaharan African (2.3%, a difference of 0.15%), Tohono O'odham (2.3%, a difference of 0.29%), Sudanese (2.3%, a difference of 0.29%), Sierra Leonean (2.3%, a difference of 0.30%), and Immigrants from Sudan (2.3%, a difference of 0.33%).
| Demographics | Rating | Rank | No Schooling Completed |
| Tongans | 6.8 /100 | #216 | Tragic 2.3% |
| Immigrants | Syria | 6.6 /100 | #217 | Tragic 2.3% |
| Immigrants | Nepal | 6.4 /100 | #218 | Tragic 2.3% |
| Senegalese | 5.6 /100 | #219 | Tragic 2.3% |
| Immigrants | Costa Rica | 5.1 /100 | #220 | Tragic 2.3% |
| Immigrants | Sudan | 5.0 /100 | #221 | Tragic 2.3% |
| Sub-Saharan Africans | 4.7 /100 | #222 | Tragic 2.3% |
| Immigrants | Lebanon | 4.5 /100 | #223 | Tragic 2.3% |
| Tohono O'odham | 4.1 /100 | #224 | Tragic 2.3% |
| Sudanese | 4.1 /100 | #225 | Tragic 2.3% |
| Sierra Leoneans | 4.1 /100 | #226 | Tragic 2.3% |
| Immigrants | Uganda | 4.0 /100 | #227 | Tragic 2.3% |
| U.S. Virgin Islanders | 3.7 /100 | #228 | Tragic 2.3% |
| Immigrants | Pakistan | 3.6 /100 | #229 | Tragic 2.3% |
| Puerto Ricans | 3.4 /100 | #230 | Tragic 2.3% |