Immigrants from Somalia vs Immigrants from South Eastern Asia Nursery School
COMPARE
Immigrants from Somalia
Immigrants from South Eastern Asia
Nursery School
Nursery School Comparison
Immigrants from Somalia
Immigrants from South Eastern Asia
97.0%
NURSERY SCHOOL
0.0/ 100
METRIC RATING
309th/ 347
METRIC RANK
97.1%
NURSERY SCHOOL
0.0/ 100
METRIC RATING
301st/ 347
METRIC RANK
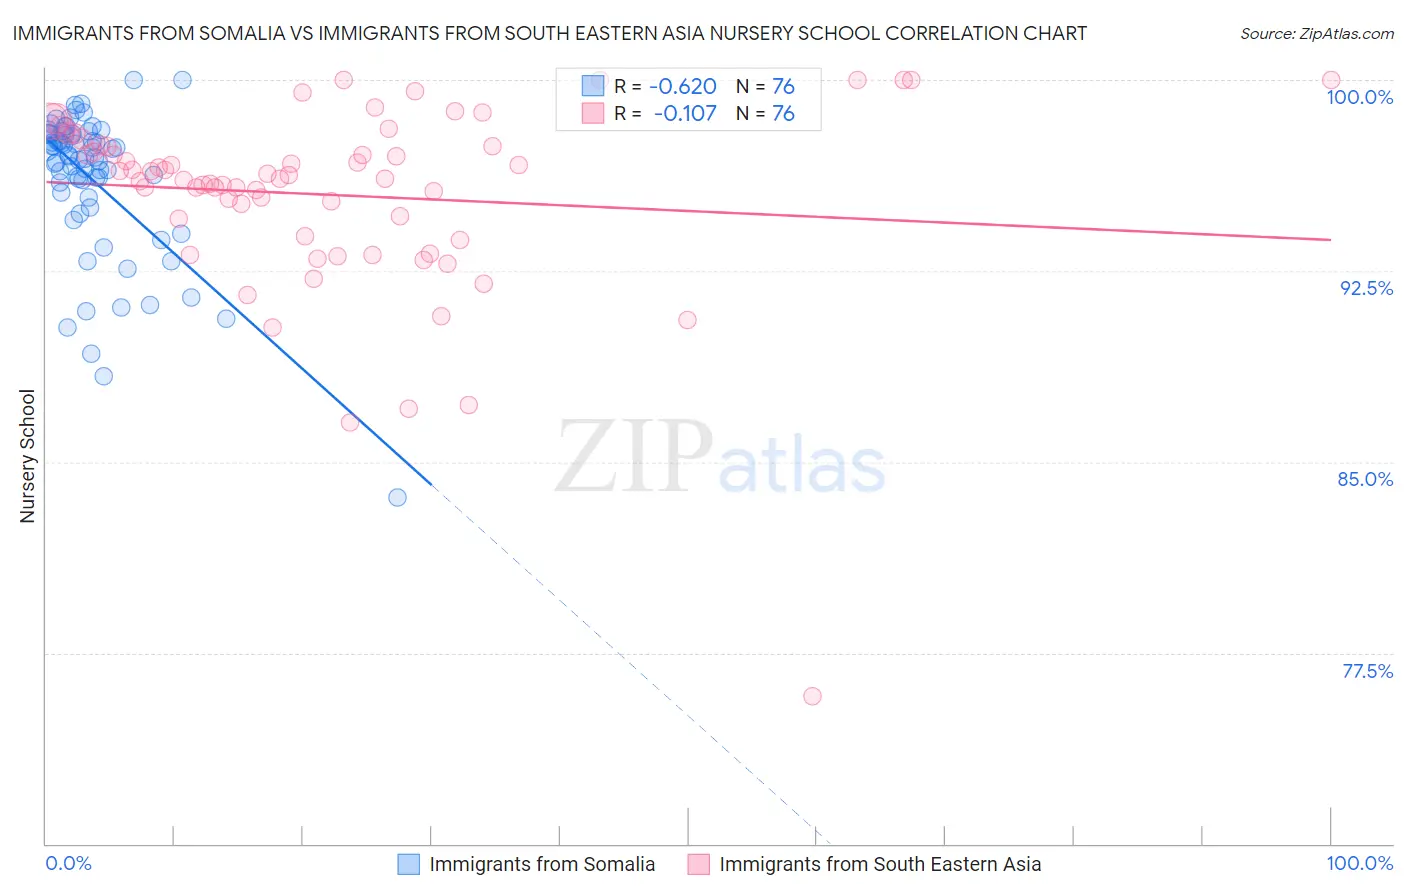
Immigrants from Somalia vs Immigrants from South Eastern Asia Nursery School Correlation Chart
The statistical analysis conducted on geographies consisting of 92,111,755 people shows a significant negative correlation between the proportion of Immigrants from Somalia and percentage of population with at least nursery school education in the United States with a correlation coefficient (R) of -0.620 and weighted average of 97.0%. Similarly, the statistical analysis conducted on geographies consisting of 512,710,277 people shows a poor negative correlation between the proportion of Immigrants from South Eastern Asia and percentage of population with at least nursery school education in the United States with a correlation coefficient (R) of -0.107 and weighted average of 97.1%, a difference of 0.14%.
Nursery School Correlation Summary
| Measurement | Immigrants from Somalia | Immigrants from South Eastern Asia |
| Minimum | 83.6% | 75.8% |
| Maximum | 100.0% | 100.0% |
| Range | 16.4% | 24.2% |
| Mean | 96.1% | 95.5% |
| Median | 97.0% | 96.2% |
| Interquartile 25% (IQ1) | 95.5% | 94.2% |
| Interquartile 75% (IQ3) | 97.9% | 97.4% |
| Interquartile Range (IQR) | 2.4% | 3.2% |
| Standard Deviation (Sample) | 2.9% | 3.7% |
| Standard Deviation (Population) | 2.9% | 3.7% |
Demographics Similar to Immigrants from Somalia and Immigrants from South Eastern Asia by Nursery School
In terms of nursery school, the demographic groups most similar to Immigrants from Somalia are Hispanic or Latino (97.0%, a difference of 0.010%), Immigrants from Haiti (97.0%, a difference of 0.010%), Guyanese (97.0%, a difference of 0.010%), Immigrants from the Azores (97.0%, a difference of 0.010%), and Sri Lankan (97.0%, a difference of 0.010%). Similarly, the demographic groups most similar to Immigrants from South Eastern Asia are Haitian (97.2%, a difference of 0.030%), Immigrants from Caribbean (97.1%, a difference of 0.030%), Central American Indian (97.2%, a difference of 0.050%), Immigrants from Dominica (97.2%, a difference of 0.050%), and Immigrants from Cuba (97.2%, a difference of 0.060%).
| Demographics | Rating | Rank | Nursery School |
| Immigrants | Immigrants | 0.0 /100 | #295 | Tragic 97.2% |
| Immigrants | Eritrea | 0.0 /100 | #296 | Tragic 97.2% |
| Immigrants | Cuba | 0.0 /100 | #297 | Tragic 97.2% |
| Central American Indians | 0.0 /100 | #298 | Tragic 97.2% |
| Immigrants | Dominica | 0.0 /100 | #299 | Tragic 97.2% |
| Haitians | 0.0 /100 | #300 | Tragic 97.2% |
| Immigrants | South Eastern Asia | 0.0 /100 | #301 | Tragic 97.1% |
| Immigrants | Caribbean | 0.0 /100 | #302 | Tragic 97.1% |
| Nicaraguans | 0.0 /100 | #303 | Tragic 97.1% |
| Ecuadorians | 0.0 /100 | #304 | Tragic 97.1% |
| Somalis | 0.0 /100 | #305 | Tragic 97.1% |
| Belizeans | 0.0 /100 | #306 | Tragic 97.0% |
| Hispanics or Latinos | 0.0 /100 | #307 | Tragic 97.0% |
| Immigrants | Haiti | 0.0 /100 | #308 | Tragic 97.0% |
| Immigrants | Somalia | 0.0 /100 | #309 | Tragic 97.0% |
| Guyanese | 0.0 /100 | #310 | Tragic 97.0% |
| Immigrants | Azores | 0.0 /100 | #311 | Tragic 97.0% |
| Sri Lankans | 0.0 /100 | #312 | Tragic 97.0% |
| Hondurans | 0.0 /100 | #313 | Tragic 97.0% |
| Cape Verdeans | 0.0 /100 | #314 | Tragic 97.0% |
| Immigrants | Nicaragua | 0.0 /100 | #315 | Tragic 96.9% |