Immigrants from Middle Africa vs Immigrants from South Eastern Asia Nursery School
COMPARE
Immigrants from Middle Africa
Immigrants from South Eastern Asia
Nursery School
Nursery School Comparison
Immigrants from Middle Africa
Immigrants from South Eastern Asia
97.6%
NURSERY SCHOOL
0.9/ 100
METRIC RATING
247th/ 347
METRIC RANK
97.1%
NURSERY SCHOOL
0.0/ 100
METRIC RATING
301st/ 347
METRIC RANK
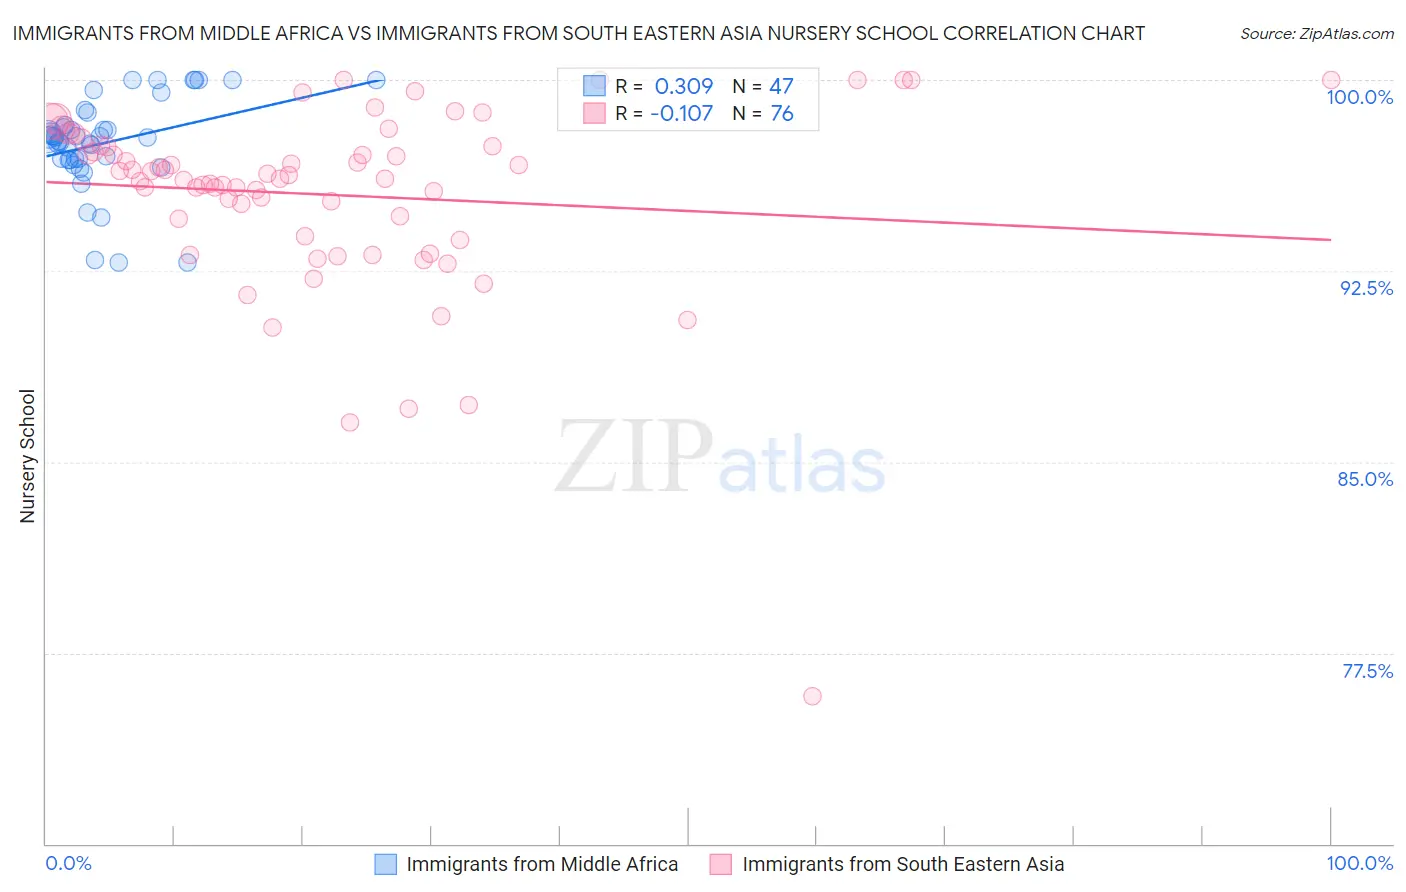
Immigrants from Middle Africa vs Immigrants from South Eastern Asia Nursery School Correlation Chart
The statistical analysis conducted on geographies consisting of 202,721,852 people shows a mild positive correlation between the proportion of Immigrants from Middle Africa and percentage of population with at least nursery school education in the United States with a correlation coefficient (R) of 0.309 and weighted average of 97.6%. Similarly, the statistical analysis conducted on geographies consisting of 512,710,277 people shows a poor negative correlation between the proportion of Immigrants from South Eastern Asia and percentage of population with at least nursery school education in the United States with a correlation coefficient (R) of -0.107 and weighted average of 97.1%, a difference of 0.52%.
Nursery School Correlation Summary
| Measurement | Immigrants from Middle Africa | Immigrants from South Eastern Asia |
| Minimum | 92.8% | 75.8% |
| Maximum | 100.0% | 100.0% |
| Range | 7.2% | 24.2% |
| Mean | 97.5% | 95.5% |
| Median | 97.8% | 96.2% |
| Interquartile 25% (IQ1) | 96.9% | 94.2% |
| Interquartile 75% (IQ3) | 98.2% | 97.4% |
| Interquartile Range (IQR) | 1.4% | 3.2% |
| Standard Deviation (Sample) | 1.8% | 3.7% |
| Standard Deviation (Population) | 1.8% | 3.7% |
Similar Demographics by Nursery School
Demographics Similar to Immigrants from Middle Africa by Nursery School
In terms of nursery school, the demographic groups most similar to Immigrants from Middle Africa are Peruvian (97.6%, a difference of 0.0%), Indian (Asian) (97.6%, a difference of 0.0%), Immigrants from Eastern Africa (97.6%, a difference of 0.0%), Immigrants from Senegal (97.6%, a difference of 0.0%), and Liberian (97.7%, a difference of 0.010%).
| Demographics | Rating | Rank | Nursery School |
| Koreans | 1.4 /100 | #240 | Tragic 97.7% |
| Immigrants | Indonesia | 1.1 /100 | #241 | Tragic 97.7% |
| Liberians | 1.1 /100 | #242 | Tragic 97.7% |
| Asians | 1.1 /100 | #243 | Tragic 97.6% |
| South Americans | 1.0 /100 | #244 | Tragic 97.6% |
| Bolivians | 1.0 /100 | #245 | Tragic 97.6% |
| Peruvians | 1.0 /100 | #246 | Tragic 97.6% |
| Immigrants | Middle Africa | 0.9 /100 | #247 | Tragic 97.6% |
| Indians (Asian) | 0.9 /100 | #248 | Tragic 97.6% |
| Immigrants | Eastern Africa | 0.9 /100 | #249 | Tragic 97.6% |
| Immigrants | Senegal | 0.9 /100 | #250 | Tragic 97.6% |
| Ethiopians | 0.8 /100 | #251 | Tragic 97.6% |
| Immigrants | Africa | 0.8 /100 | #252 | Tragic 97.6% |
| Immigrants | Iraq | 0.7 /100 | #253 | Tragic 97.6% |
| Immigrants | Congo | 0.7 /100 | #254 | Tragic 97.6% |
Demographics Similar to Immigrants from South Eastern Asia by Nursery School
In terms of nursery school, the demographic groups most similar to Immigrants from South Eastern Asia are Haitian (97.2%, a difference of 0.030%), Immigrants from Caribbean (97.1%, a difference of 0.030%), Central American Indian (97.2%, a difference of 0.050%), Immigrants from Dominica (97.2%, a difference of 0.050%), and Immigrants from Cuba (97.2%, a difference of 0.060%).
| Demographics | Rating | Rank | Nursery School |
| Immigrants | Grenada | 0.0 /100 | #294 | Tragic 97.3% |
| Immigrants | Immigrants | 0.0 /100 | #295 | Tragic 97.2% |
| Immigrants | Eritrea | 0.0 /100 | #296 | Tragic 97.2% |
| Immigrants | Cuba | 0.0 /100 | #297 | Tragic 97.2% |
| Central American Indians | 0.0 /100 | #298 | Tragic 97.2% |
| Immigrants | Dominica | 0.0 /100 | #299 | Tragic 97.2% |
| Haitians | 0.0 /100 | #300 | Tragic 97.2% |
| Immigrants | South Eastern Asia | 0.0 /100 | #301 | Tragic 97.1% |
| Immigrants | Caribbean | 0.0 /100 | #302 | Tragic 97.1% |
| Nicaraguans | 0.0 /100 | #303 | Tragic 97.1% |
| Ecuadorians | 0.0 /100 | #304 | Tragic 97.1% |
| Somalis | 0.0 /100 | #305 | Tragic 97.1% |
| Belizeans | 0.0 /100 | #306 | Tragic 97.0% |
| Hispanics or Latinos | 0.0 /100 | #307 | Tragic 97.0% |
| Immigrants | Haiti | 0.0 /100 | #308 | Tragic 97.0% |