Immigrants from Somalia vs Spanish American Nursery School
COMPARE
Immigrants from Somalia
Spanish American
Nursery School
Nursery School Comparison
Immigrants from Somalia
Spanish Americans
97.0%
NURSERY SCHOOL
0.0/ 100
METRIC RATING
309th/ 347
METRIC RANK
98.0%
NURSERY SCHOOL
55.6/ 100
METRIC RATING
166th/ 347
METRIC RANK
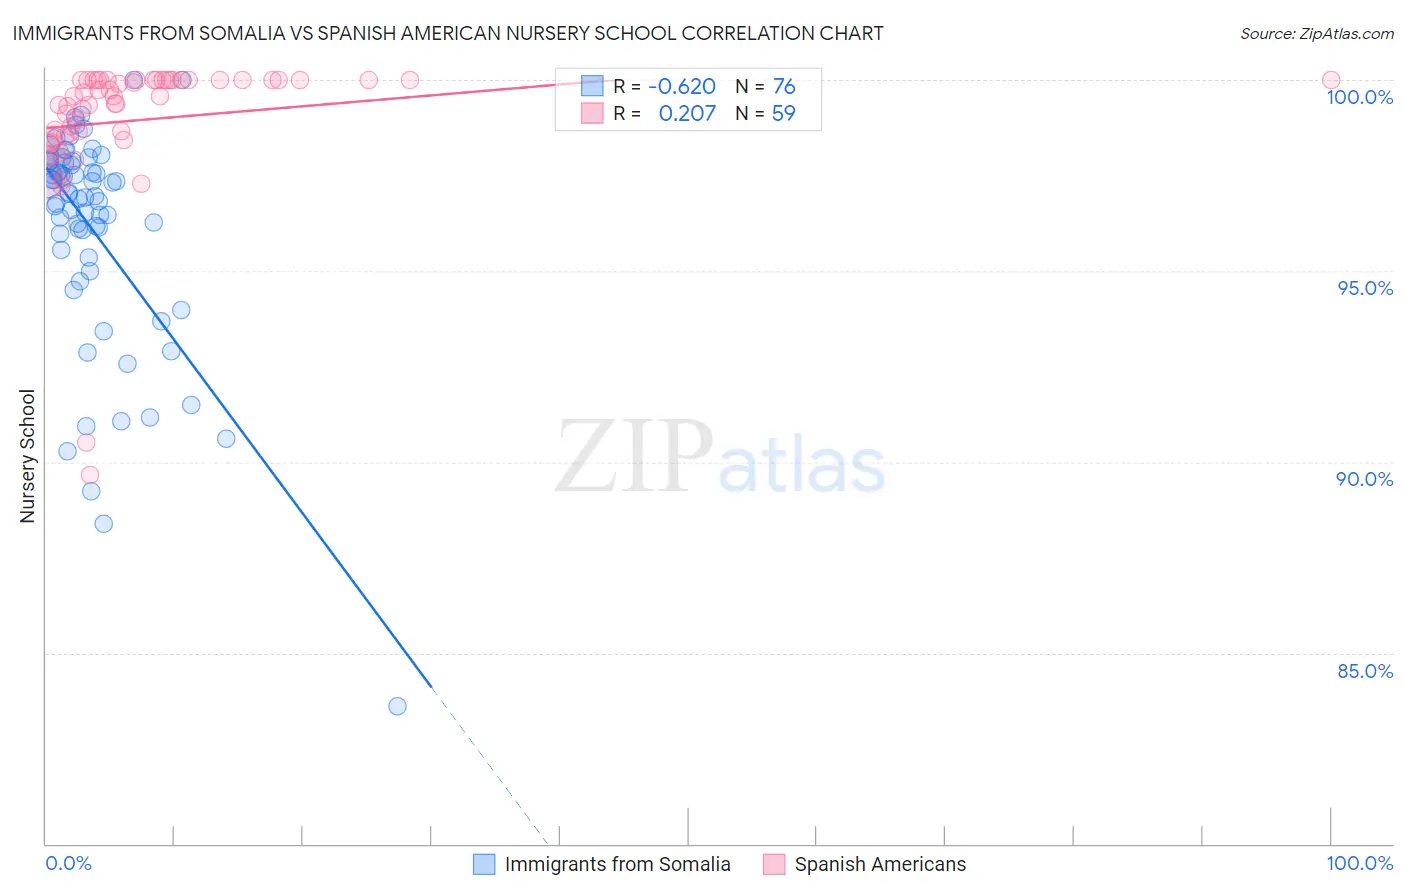
Immigrants from Somalia vs Spanish American Nursery School Correlation Chart
The statistical analysis conducted on geographies consisting of 92,111,755 people shows a significant negative correlation between the proportion of Immigrants from Somalia and percentage of population with at least nursery school education in the United States with a correlation coefficient (R) of -0.620 and weighted average of 97.0%. Similarly, the statistical analysis conducted on geographies consisting of 103,168,542 people shows a weak positive correlation between the proportion of Spanish Americans and percentage of population with at least nursery school education in the United States with a correlation coefficient (R) of 0.207 and weighted average of 98.0%, a difference of 1.0%.
Nursery School Correlation Summary
| Measurement | Immigrants from Somalia | Spanish American |
| Minimum | 83.6% | 89.6% |
| Maximum | 100.0% | 100.0% |
| Range | 16.4% | 10.4% |
| Mean | 96.1% | 99.0% |
| Median | 97.0% | 99.6% |
| Interquartile 25% (IQ1) | 95.5% | 98.5% |
| Interquartile 75% (IQ3) | 97.9% | 100.0% |
| Interquartile Range (IQR) | 2.4% | 1.5% |
| Standard Deviation (Sample) | 2.9% | 1.9% |
| Standard Deviation (Population) | 2.9% | 1.9% |
Similar Demographics by Nursery School
Demographics Similar to Immigrants from Somalia by Nursery School
In terms of nursery school, the demographic groups most similar to Immigrants from Somalia are Hispanic or Latino (97.0%, a difference of 0.010%), Immigrants from Haiti (97.0%, a difference of 0.010%), Guyanese (97.0%, a difference of 0.010%), Immigrants from the Azores (97.0%, a difference of 0.010%), and Sri Lankan (97.0%, a difference of 0.010%).
| Demographics | Rating | Rank | Nursery School |
| Immigrants | Caribbean | 0.0 /100 | #302 | Tragic 97.1% |
| Nicaraguans | 0.0 /100 | #303 | Tragic 97.1% |
| Ecuadorians | 0.0 /100 | #304 | Tragic 97.1% |
| Somalis | 0.0 /100 | #305 | Tragic 97.1% |
| Belizeans | 0.0 /100 | #306 | Tragic 97.0% |
| Hispanics or Latinos | 0.0 /100 | #307 | Tragic 97.0% |
| Immigrants | Haiti | 0.0 /100 | #308 | Tragic 97.0% |
| Immigrants | Somalia | 0.0 /100 | #309 | Tragic 97.0% |
| Guyanese | 0.0 /100 | #310 | Tragic 97.0% |
| Immigrants | Azores | 0.0 /100 | #311 | Tragic 97.0% |
| Sri Lankans | 0.0 /100 | #312 | Tragic 97.0% |
| Hondurans | 0.0 /100 | #313 | Tragic 97.0% |
| Cape Verdeans | 0.0 /100 | #314 | Tragic 97.0% |
| Immigrants | Nicaragua | 0.0 /100 | #315 | Tragic 96.9% |
| Immigrants | Belize | 0.0 /100 | #316 | Tragic 96.9% |
Demographics Similar to Spanish Americans by Nursery School
In terms of nursery school, the demographic groups most similar to Spanish Americans are Ugandan (98.0%, a difference of 0.0%), Chilean (98.0%, a difference of 0.0%), Immigrants from Spain (98.0%, a difference of 0.0%), Immigrants from Micronesia (98.0%, a difference of 0.0%), and Immigrants from Russia (98.0%, a difference of 0.010%).
| Demographics | Rating | Rank | Nursery School |
| French American Indians | 62.1 /100 | #159 | Good 98.0% |
| Immigrants | Russia | 59.9 /100 | #160 | Average 98.0% |
| Immigrants | Eastern Europe | 59.7 /100 | #161 | Average 98.0% |
| Brazilians | 59.4 /100 | #162 | Average 98.0% |
| Immigrants | Italy | 59.0 /100 | #163 | Average 98.0% |
| Ugandans | 56.4 /100 | #164 | Average 98.0% |
| Chileans | 56.4 /100 | #165 | Average 98.0% |
| Spanish Americans | 55.6 /100 | #166 | Average 98.0% |
| Immigrants | Spain | 55.6 /100 | #167 | Average 98.0% |
| Immigrants | Micronesia | 55.0 /100 | #168 | Average 98.0% |
| Immigrants | Korea | 53.8 /100 | #169 | Average 98.0% |
| Bermudans | 53.7 /100 | #170 | Average 98.0% |
| Immigrants | Jordan | 53.4 /100 | #171 | Average 98.0% |
| Immigrants | Brazil | 51.3 /100 | #172 | Average 98.0% |
| Kenyans | 50.2 /100 | #173 | Average 98.0% |