Immigrants from Somalia vs Native/Alaskan Nursery School
COMPARE
Immigrants from Somalia
Native/Alaskan
Nursery School
Nursery School Comparison
Immigrants from Somalia
Natives/Alaskans
97.0%
NURSERY SCHOOL
0.0/ 100
METRIC RATING
309th/ 347
METRIC RANK
98.0%
NURSERY SCHOOL
48.6/ 100
METRIC RATING
178th/ 347
METRIC RANK
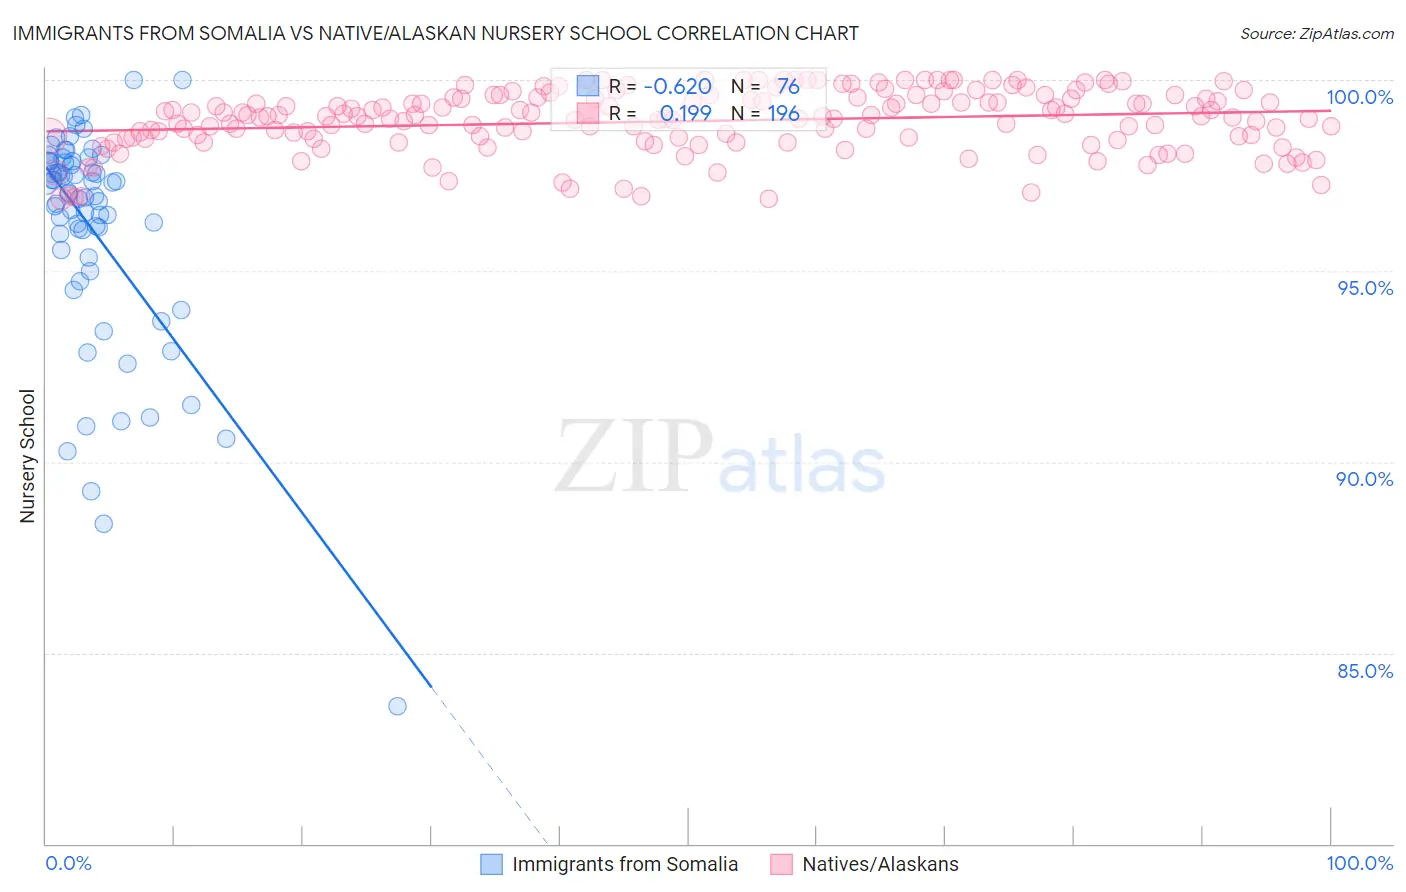
Immigrants from Somalia vs Native/Alaskan Nursery School Correlation Chart
The statistical analysis conducted on geographies consisting of 92,111,755 people shows a significant negative correlation between the proportion of Immigrants from Somalia and percentage of population with at least nursery school education in the United States with a correlation coefficient (R) of -0.620 and weighted average of 97.0%. Similarly, the statistical analysis conducted on geographies consisting of 513,036,548 people shows a poor positive correlation between the proportion of Natives/Alaskans and percentage of population with at least nursery school education in the United States with a correlation coefficient (R) of 0.199 and weighted average of 98.0%, a difference of 1.0%.
Nursery School Correlation Summary
| Measurement | Immigrants from Somalia | Native/Alaskan |
| Minimum | 83.6% | 96.9% |
| Maximum | 100.0% | 100.0% |
| Range | 16.4% | 3.1% |
| Mean | 96.1% | 98.9% |
| Median | 97.0% | 99.0% |
| Interquartile 25% (IQ1) | 95.5% | 98.5% |
| Interquartile 75% (IQ3) | 97.9% | 99.5% |
| Interquartile Range (IQR) | 2.4% | 1.1% |
| Standard Deviation (Sample) | 2.9% | 0.79% |
| Standard Deviation (Population) | 2.9% | 0.79% |
Similar Demographics by Nursery School
Demographics Similar to Immigrants from Somalia by Nursery School
In terms of nursery school, the demographic groups most similar to Immigrants from Somalia are Hispanic or Latino (97.0%, a difference of 0.010%), Immigrants from Haiti (97.0%, a difference of 0.010%), Guyanese (97.0%, a difference of 0.010%), Immigrants from the Azores (97.0%, a difference of 0.010%), and Sri Lankan (97.0%, a difference of 0.010%).
| Demographics | Rating | Rank | Nursery School |
| Immigrants | Caribbean | 0.0 /100 | #302 | Tragic 97.1% |
| Nicaraguans | 0.0 /100 | #303 | Tragic 97.1% |
| Ecuadorians | 0.0 /100 | #304 | Tragic 97.1% |
| Somalis | 0.0 /100 | #305 | Tragic 97.1% |
| Belizeans | 0.0 /100 | #306 | Tragic 97.0% |
| Hispanics or Latinos | 0.0 /100 | #307 | Tragic 97.0% |
| Immigrants | Haiti | 0.0 /100 | #308 | Tragic 97.0% |
| Immigrants | Somalia | 0.0 /100 | #309 | Tragic 97.0% |
| Guyanese | 0.0 /100 | #310 | Tragic 97.0% |
| Immigrants | Azores | 0.0 /100 | #311 | Tragic 97.0% |
| Sri Lankans | 0.0 /100 | #312 | Tragic 97.0% |
| Hondurans | 0.0 /100 | #313 | Tragic 97.0% |
| Cape Verdeans | 0.0 /100 | #314 | Tragic 97.0% |
| Immigrants | Nicaragua | 0.0 /100 | #315 | Tragic 96.9% |
| Immigrants | Belize | 0.0 /100 | #316 | Tragic 96.9% |
Demographics Similar to Natives/Alaskans by Nursery School
In terms of nursery school, the demographic groups most similar to Natives/Alaskans are Kenyan (98.0%, a difference of 0.0%), Navajo (98.0%, a difference of 0.0%), Immigrants from Sri Lanka (98.0%, a difference of 0.0%), Immigrants from Venezuela (98.0%, a difference of 0.0%), and Albanian (98.0%, a difference of 0.0%).
| Demographics | Rating | Rank | Nursery School |
| Immigrants | Jordan | 53.4 /100 | #171 | Average 98.0% |
| Immigrants | Brazil | 51.3 /100 | #172 | Average 98.0% |
| Kenyans | 50.2 /100 | #173 | Average 98.0% |
| Navajo | 50.0 /100 | #174 | Average 98.0% |
| Immigrants | Sri Lanka | 49.9 /100 | #175 | Average 98.0% |
| Immigrants | Venezuela | 49.8 /100 | #176 | Average 98.0% |
| Albanians | 48.9 /100 | #177 | Average 98.0% |
| Natives/Alaskans | 48.6 /100 | #178 | Average 98.0% |
| Argentineans | 46.8 /100 | #179 | Average 98.0% |
| Immigrants | Bosnia and Herzegovina | 45.6 /100 | #180 | Average 98.0% |
| Egyptians | 42.8 /100 | #181 | Average 98.0% |
| Paiute | 42.0 /100 | #182 | Average 98.0% |
| Portuguese | 41.8 /100 | #183 | Average 98.0% |
| Immigrants | Poland | 41.3 /100 | #184 | Average 98.0% |
| Immigrants | Belarus | 41.0 /100 | #185 | Average 98.0% |