Dutch West Indian vs Immigrants from South Eastern Asia Nursery School
COMPARE
Dutch West Indian
Immigrants from South Eastern Asia
Nursery School
Nursery School Comparison
Dutch West Indians
Immigrants from South Eastern Asia
98.0%
NURSERY SCHOOL
70.2/ 100
METRIC RATING
152nd/ 347
METRIC RANK
97.1%
NURSERY SCHOOL
0.0/ 100
METRIC RATING
301st/ 347
METRIC RANK
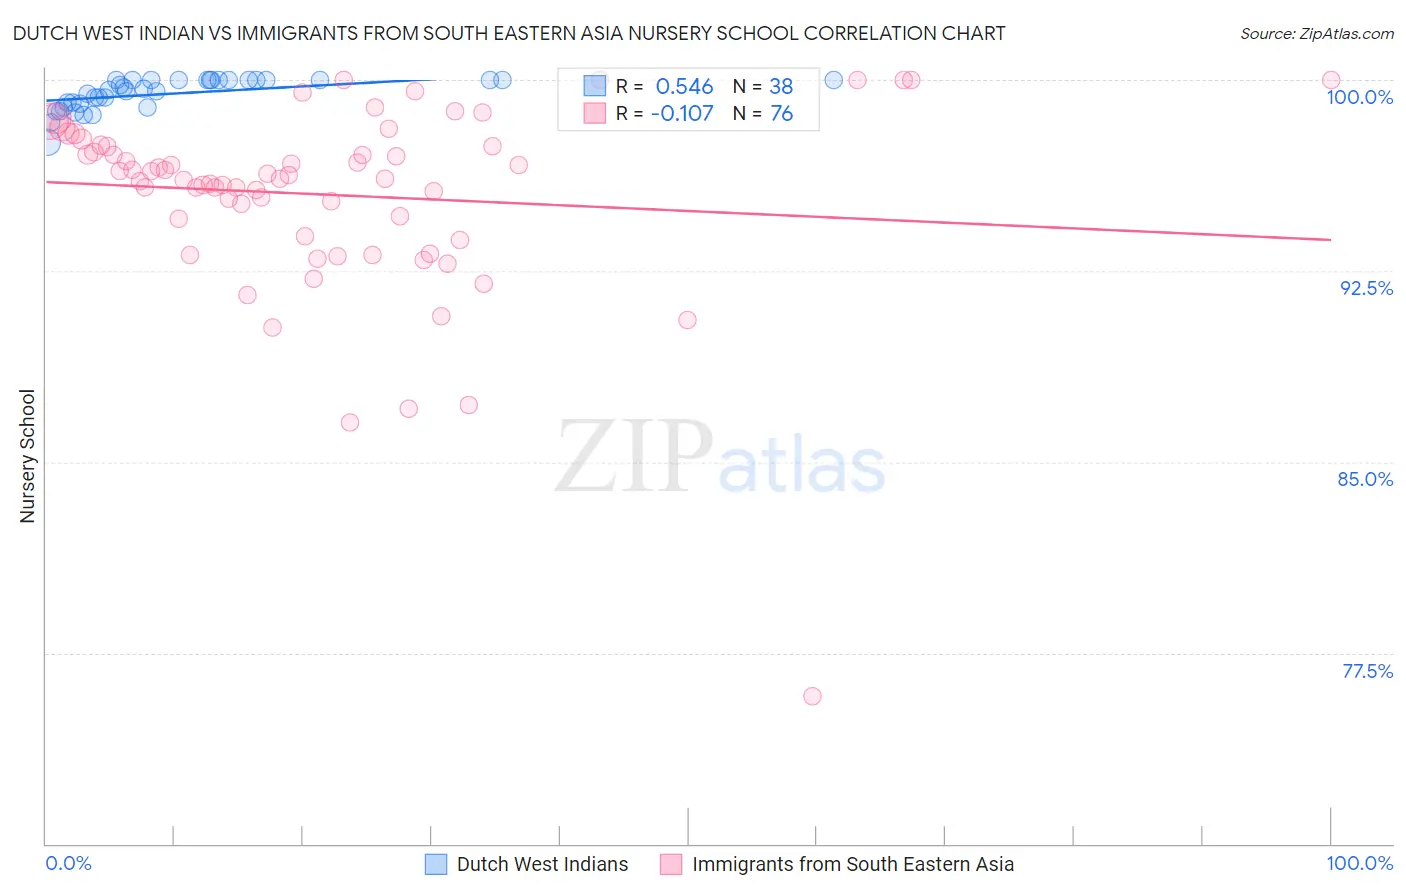
Dutch West Indian vs Immigrants from South Eastern Asia Nursery School Correlation Chart
The statistical analysis conducted on geographies consisting of 85,776,075 people shows a substantial positive correlation between the proportion of Dutch West Indians and percentage of population with at least nursery school education in the United States with a correlation coefficient (R) of 0.546 and weighted average of 98.0%. Similarly, the statistical analysis conducted on geographies consisting of 512,710,277 people shows a poor negative correlation between the proportion of Immigrants from South Eastern Asia and percentage of population with at least nursery school education in the United States with a correlation coefficient (R) of -0.107 and weighted average of 97.1%, a difference of 0.93%.
Nursery School Correlation Summary
| Measurement | Dutch West Indian | Immigrants from South Eastern Asia |
| Minimum | 97.6% | 75.8% |
| Maximum | 100.0% | 100.0% |
| Range | 2.4% | 24.2% |
| Mean | 99.5% | 95.5% |
| Median | 99.6% | 96.2% |
| Interquartile 25% (IQ1) | 99.0% | 94.2% |
| Interquartile 75% (IQ3) | 100.0% | 97.4% |
| Interquartile Range (IQR) | 0.95% | 3.2% |
| Standard Deviation (Sample) | 0.61% | 3.7% |
| Standard Deviation (Population) | 0.60% | 3.7% |
Similar Demographics by Nursery School
Demographics Similar to Dutch West Indians by Nursery School
In terms of nursery school, the demographic groups most similar to Dutch West Indians are Immigrants from Moldova (98.0%, a difference of 0.0%), Apache (98.1%, a difference of 0.010%), Jordanian (98.1%, a difference of 0.010%), Soviet Union (98.0%, a difference of 0.010%), and Immigrants from Iran (98.0%, a difference of 0.010%).
| Demographics | Rating | Rank | Nursery School |
| Immigrants | Israel | 78.5 /100 | #145 | Good 98.1% |
| Filipinos | 78.5 /100 | #146 | Good 98.1% |
| Hmong | 75.7 /100 | #147 | Good 98.1% |
| Immigrants | Greece | 75.4 /100 | #148 | Good 98.1% |
| Apache | 73.2 /100 | #149 | Good 98.1% |
| Jordanians | 72.9 /100 | #150 | Good 98.1% |
| Soviet Union | 71.6 /100 | #151 | Good 98.0% |
| Dutch West Indians | 70.2 /100 | #152 | Good 98.0% |
| Immigrants | Moldova | 69.6 /100 | #153 | Good 98.0% |
| Immigrants | Iran | 68.7 /100 | #154 | Good 98.0% |
| Immigrants | South Central Asia | 66.7 /100 | #155 | Good 98.0% |
| Venezuelans | 66.6 /100 | #156 | Good 98.0% |
| Comanche | 66.0 /100 | #157 | Good 98.0% |
| Immigrants | North Macedonia | 65.7 /100 | #158 | Good 98.0% |
| French American Indians | 62.1 /100 | #159 | Good 98.0% |
Demographics Similar to Immigrants from South Eastern Asia by Nursery School
In terms of nursery school, the demographic groups most similar to Immigrants from South Eastern Asia are Haitian (97.2%, a difference of 0.030%), Immigrants from Caribbean (97.1%, a difference of 0.030%), Central American Indian (97.2%, a difference of 0.050%), Immigrants from Dominica (97.2%, a difference of 0.050%), and Immigrants from Cuba (97.2%, a difference of 0.060%).
| Demographics | Rating | Rank | Nursery School |
| Immigrants | Grenada | 0.0 /100 | #294 | Tragic 97.3% |
| Immigrants | Immigrants | 0.0 /100 | #295 | Tragic 97.2% |
| Immigrants | Eritrea | 0.0 /100 | #296 | Tragic 97.2% |
| Immigrants | Cuba | 0.0 /100 | #297 | Tragic 97.2% |
| Central American Indians | 0.0 /100 | #298 | Tragic 97.2% |
| Immigrants | Dominica | 0.0 /100 | #299 | Tragic 97.2% |
| Haitians | 0.0 /100 | #300 | Tragic 97.2% |
| Immigrants | South Eastern Asia | 0.0 /100 | #301 | Tragic 97.1% |
| Immigrants | Caribbean | 0.0 /100 | #302 | Tragic 97.1% |
| Nicaraguans | 0.0 /100 | #303 | Tragic 97.1% |
| Ecuadorians | 0.0 /100 | #304 | Tragic 97.1% |
| Somalis | 0.0 /100 | #305 | Tragic 97.1% |
| Belizeans | 0.0 /100 | #306 | Tragic 97.0% |
| Hispanics or Latinos | 0.0 /100 | #307 | Tragic 97.0% |
| Immigrants | Haiti | 0.0 /100 | #308 | Tragic 97.0% |