Immigrants from Somalia vs Immigrants from South Eastern Asia Unemployment Among Seniors over 65 years
COMPARE
Immigrants from Somalia
Immigrants from South Eastern Asia
Unemployment Among Seniors over 65 years
Unemployment Among Seniors over 65 years Comparison
Immigrants from Somalia
Immigrants from South Eastern Asia
5.2%
UNEMPLOYMENT AMONG SENIORS OVER 65 YEARS
44.0/ 100
METRIC RATING
179th/ 347
METRIC RANK
5.1%
UNEMPLOYMENT AMONG SENIORS OVER 65 YEARS
65.6/ 100
METRIC RATING
162nd/ 347
METRIC RANK
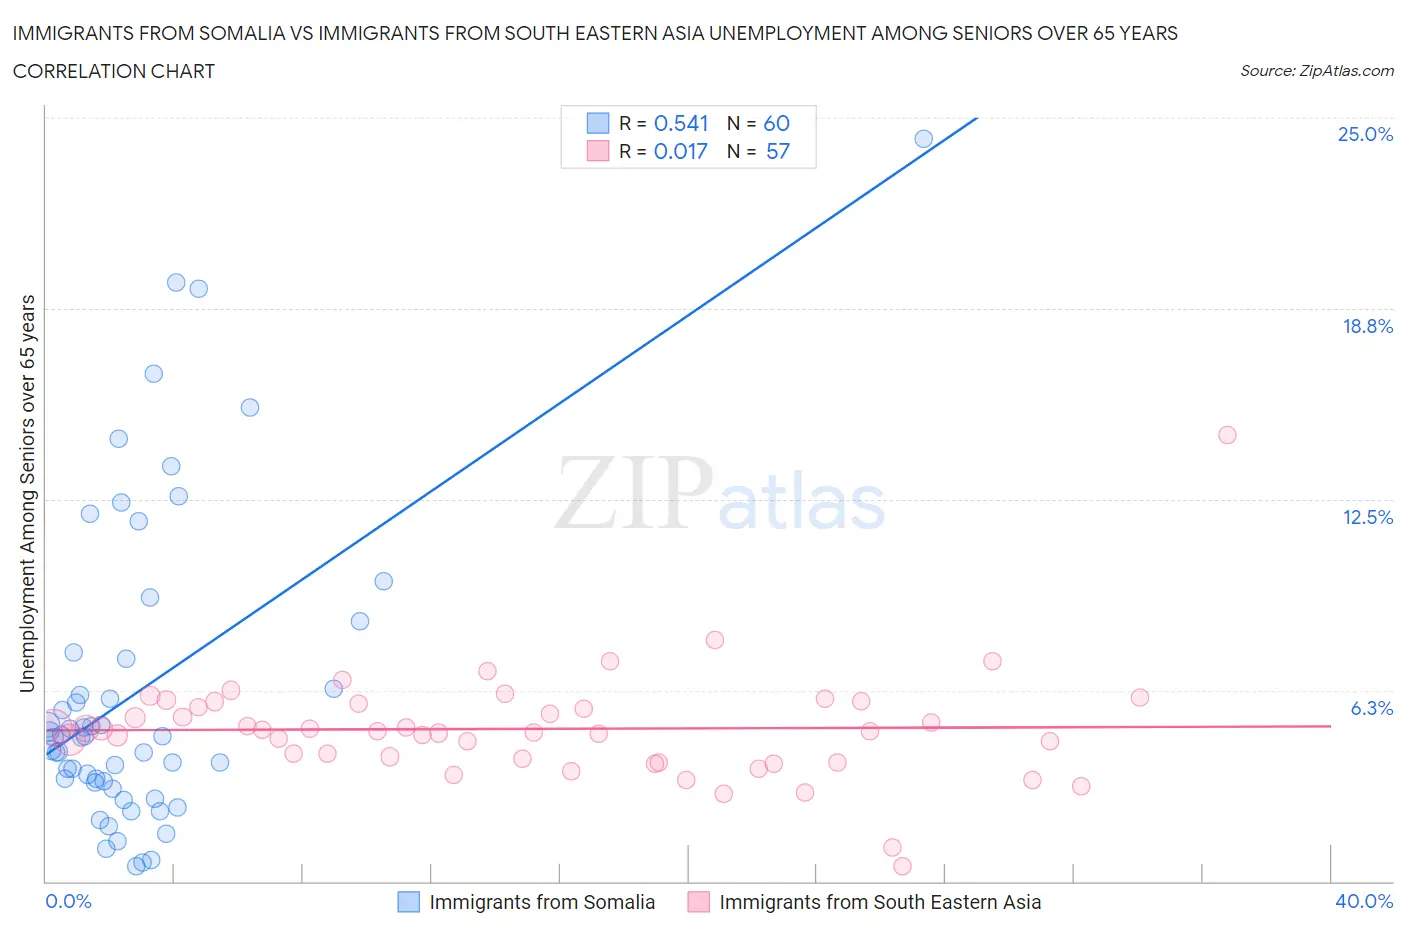
Immigrants from Somalia vs Immigrants from South Eastern Asia Unemployment Among Seniors over 65 years Correlation Chart
The statistical analysis conducted on geographies consisting of 88,494,668 people shows a substantial positive correlation between the proportion of Immigrants from Somalia and unemployment rate amomg seniors over the age of 65 in the United States with a correlation coefficient (R) of 0.541 and weighted average of 5.2%. Similarly, the statistical analysis conducted on geographies consisting of 438,289,395 people shows no correlation between the proportion of Immigrants from South Eastern Asia and unemployment rate amomg seniors over the age of 65 in the United States with a correlation coefficient (R) of 0.017 and weighted average of 5.1%, a difference of 0.71%.
Unemployment Among Seniors over 65 years Correlation Summary
| Measurement | Immigrants from Somalia | Immigrants from South Eastern Asia |
| Minimum | 0.50% | 0.50% |
| Maximum | 24.3% | 14.6% |
| Range | 23.8% | 14.1% |
| Mean | 6.3% | 5.0% |
| Median | 4.7% | 4.9% |
| Interquartile 25% (IQ1) | 3.2% | 3.9% |
| Interquartile 75% (IQ3) | 7.4% | 5.8% |
| Interquartile Range (IQR) | 4.1% | 1.9% |
| Standard Deviation (Sample) | 5.1% | 1.9% |
| Standard Deviation (Population) | 5.1% | 1.9% |
Demographics Similar to Immigrants from Somalia and Immigrants from South Eastern Asia by Unemployment Among Seniors over 65 years
In terms of unemployment among seniors over 65 years, the demographic groups most similar to Immigrants from Somalia are Russian (5.2%, a difference of 0.010%), Immigrants from Belgium (5.2%, a difference of 0.020%), Icelander (5.2%, a difference of 0.060%), Indian (Asian) (5.2%, a difference of 0.080%), and Immigrants from Eastern Europe (5.1%, a difference of 0.18%). Similarly, the demographic groups most similar to Immigrants from South Eastern Asia are Immigrants from Bosnia and Herzegovina (5.1%, a difference of 0.020%), Potawatomi (5.1%, a difference of 0.040%), Nepalese (5.1%, a difference of 0.040%), Immigrants from Ukraine (5.1%, a difference of 0.050%), and Immigrants from Laos (5.1%, a difference of 0.060%).
| Demographics | Rating | Rank | Unemployment Among Seniors over 65 years |
| French | 68.1 /100 | #160 | Good 5.1% |
| Immigrants | Bosnia and Herzegovina | 66.1 /100 | #161 | Good 5.1% |
| Immigrants | South Eastern Asia | 65.6 /100 | #162 | Good 5.1% |
| Potawatomi | 64.5 /100 | #163 | Good 5.1% |
| Nepalese | 64.5 /100 | #164 | Good 5.1% |
| Immigrants | Ukraine | 64.2 /100 | #165 | Good 5.1% |
| Immigrants | Laos | 63.8 /100 | #166 | Good 5.1% |
| Immigrants | Western Europe | 60.4 /100 | #167 | Good 5.1% |
| Mongolians | 59.8 /100 | #168 | Average 5.1% |
| Lithuanians | 58.2 /100 | #169 | Average 5.1% |
| Immigrants | Eastern Asia | 54.9 /100 | #170 | Average 5.1% |
| Immigrants | Nonimmigrants | 54.1 /100 | #171 | Average 5.1% |
| Immigrants | Ireland | 53.2 /100 | #172 | Average 5.1% |
| Immigrants | Spain | 51.7 /100 | #173 | Average 5.1% |
| Spanish Americans | 50.0 /100 | #174 | Average 5.1% |
| Immigrants | Eastern Europe | 49.8 /100 | #175 | Average 5.1% |
| Indians (Asian) | 46.6 /100 | #176 | Average 5.2% |
| Icelanders | 45.9 /100 | #177 | Average 5.2% |
| Immigrants | Belgium | 44.8 /100 | #178 | Average 5.2% |
| Immigrants | Somalia | 44.0 /100 | #179 | Average 5.2% |
| Russians | 43.6 /100 | #180 | Average 5.2% |