Immigrants from Sierra Leone vs French 3rd Grade
COMPARE
Immigrants from Sierra Leone
French
3rd Grade
3rd Grade Comparison
Immigrants from Sierra Leone
French
97.3%
3RD GRADE
0.4/ 100
METRIC RATING
262nd/ 347
METRIC RANK
98.4%
3RD GRADE
100.0/ 100
METRIC RATING
28th/ 347
METRIC RANK
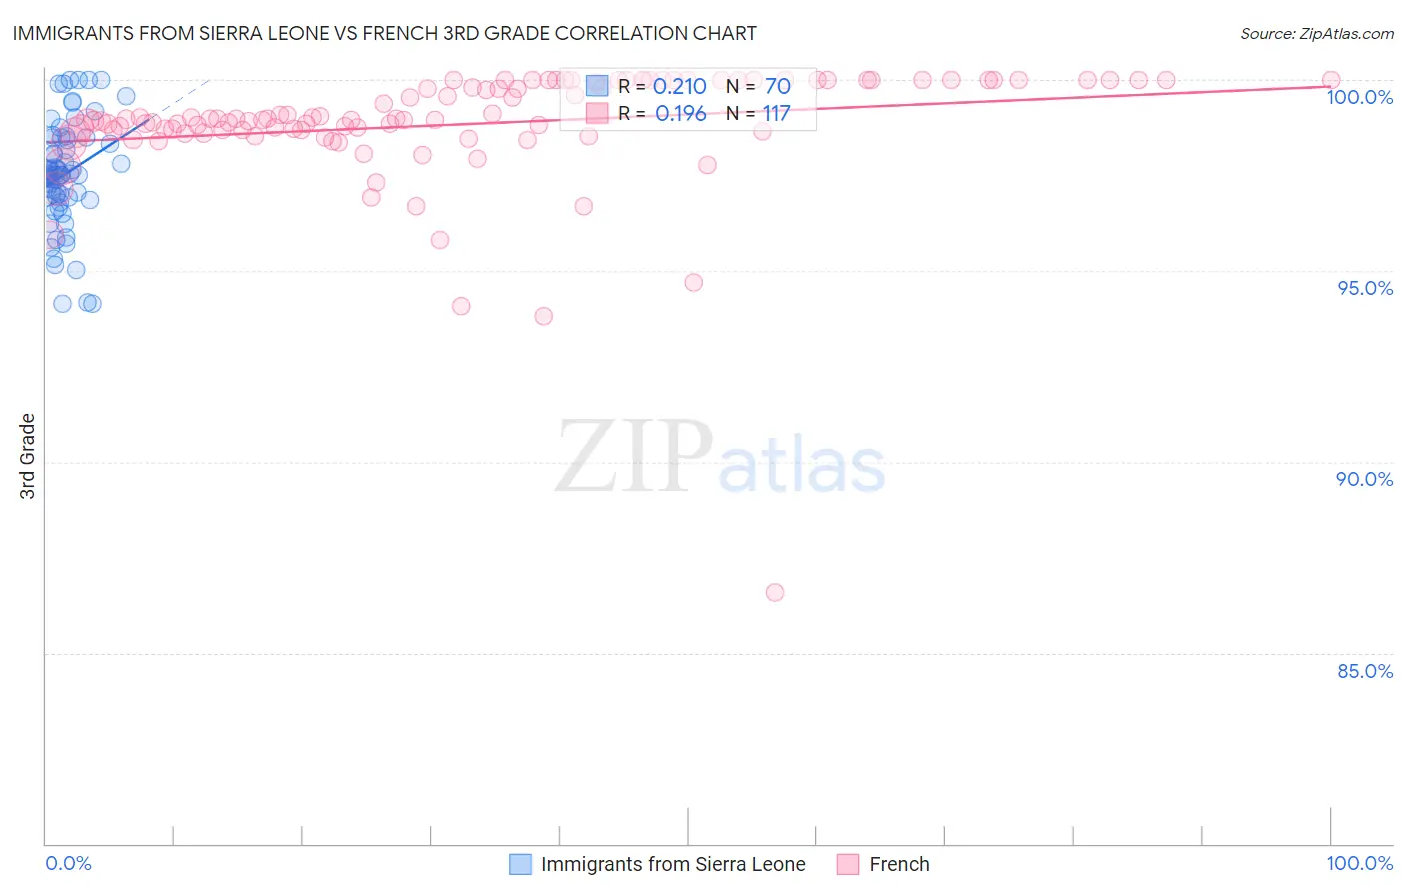
Immigrants from Sierra Leone vs French 3rd Grade Correlation Chart
The statistical analysis conducted on geographies consisting of 101,634,956 people shows a weak positive correlation between the proportion of Immigrants from Sierra Leone and percentage of population with at least 3rd grade education in the United States with a correlation coefficient (R) of 0.210 and weighted average of 97.3%. Similarly, the statistical analysis conducted on geographies consisting of 572,427,269 people shows a poor positive correlation between the proportion of French and percentage of population with at least 3rd grade education in the United States with a correlation coefficient (R) of 0.196 and weighted average of 98.4%, a difference of 1.2%.
3rd Grade Correlation Summary
| Measurement | Immigrants from Sierra Leone | French |
| Minimum | 94.1% | 86.6% |
| Maximum | 100.0% | 100.0% |
| Range | 5.9% | 13.4% |
| Mean | 97.5% | 98.8% |
| Median | 97.5% | 99.0% |
| Interquartile 25% (IQ1) | 96.9% | 98.6% |
| Interquartile 75% (IQ3) | 98.5% | 100.0% |
| Interquartile Range (IQR) | 1.6% | 1.4% |
| Standard Deviation (Sample) | 1.4% | 1.6% |
| Standard Deviation (Population) | 1.4% | 1.6% |
Similar Demographics by 3rd Grade
Demographics Similar to Immigrants from Sierra Leone by 3rd Grade
In terms of 3rd grade, the demographic groups most similar to Immigrants from Sierra Leone are Taiwanese (97.3%, a difference of 0.0%), Immigrants from Ethiopia (97.3%, a difference of 0.010%), Immigrants from South America (97.3%, a difference of 0.010%), West Indian (97.3%, a difference of 0.010%), and Immigrants from Liberia (97.3%, a difference of 0.020%).
| Demographics | Rating | Rank | 3rd Grade |
| Bolivians | 0.6 /100 | #255 | Tragic 97.3% |
| Immigrants | Congo | 0.6 /100 | #256 | Tragic 97.3% |
| Immigrants | Colombia | 0.5 /100 | #257 | Tragic 97.3% |
| Immigrants | Liberia | 0.5 /100 | #258 | Tragic 97.3% |
| Armenians | 0.4 /100 | #259 | Tragic 97.3% |
| Immigrants | Ethiopia | 0.4 /100 | #260 | Tragic 97.3% |
| Immigrants | South America | 0.4 /100 | #261 | Tragic 97.3% |
| Immigrants | Sierra Leone | 0.4 /100 | #262 | Tragic 97.3% |
| Taiwanese | 0.3 /100 | #263 | Tragic 97.3% |
| West Indians | 0.3 /100 | #264 | Tragic 97.3% |
| Immigrants | Jamaica | 0.3 /100 | #265 | Tragic 97.3% |
| Yaqui | 0.3 /100 | #266 | Tragic 97.3% |
| Immigrants | Nigeria | 0.3 /100 | #267 | Tragic 97.3% |
| Cubans | 0.2 /100 | #268 | Tragic 97.3% |
| Fijians | 0.2 /100 | #269 | Tragic 97.3% |
Demographics Similar to French by 3rd Grade
In terms of 3rd grade, the demographic groups most similar to French are Croatian (98.5%, a difference of 0.010%), French Canadian (98.4%, a difference of 0.010%), European (98.4%, a difference of 0.010%), Czech (98.4%, a difference of 0.010%), and Scotch-Irish (98.5%, a difference of 0.020%).
| Demographics | Rating | Rank | 3rd Grade |
| Lithuanians | 100.0 /100 | #21 | Exceptional 98.5% |
| Finns | 100.0 /100 | #22 | Exceptional 98.5% |
| Sioux | 100.0 /100 | #23 | Exceptional 98.5% |
| Danes | 100.0 /100 | #24 | Exceptional 98.5% |
| Scotch-Irish | 100.0 /100 | #25 | Exceptional 98.5% |
| Aleuts | 100.0 /100 | #26 | Exceptional 98.5% |
| Croatians | 100.0 /100 | #27 | Exceptional 98.5% |
| French | 100.0 /100 | #28 | Exceptional 98.4% |
| French Canadians | 100.0 /100 | #29 | Exceptional 98.4% |
| Europeans | 100.0 /100 | #30 | Exceptional 98.4% |
| Czechs | 100.0 /100 | #31 | Exceptional 98.4% |
| Scandinavians | 100.0 /100 | #32 | Exceptional 98.4% |
| Chinese | 100.0 /100 | #33 | Exceptional 98.4% |
| Swiss | 100.0 /100 | #34 | Exceptional 98.4% |
| Arapaho | 100.0 /100 | #35 | Exceptional 98.4% |