Immigrants from Sierra Leone vs Immigrants from the Azores College, 1 year or more
COMPARE
Immigrants from Sierra Leone
Immigrants from the Azores
College, 1 year or more
College, 1 year or more Comparison
Immigrants from Sierra Leone
Immigrants from the Azores
59.5%
COLLEGE, 1 YEAR OR MORE
52.2/ 100
METRIC RATING
172nd/ 347
METRIC RANK
48.4%
COLLEGE, 1 YEAR OR MORE
0.0/ 100
METRIC RATING
339th/ 347
METRIC RANK
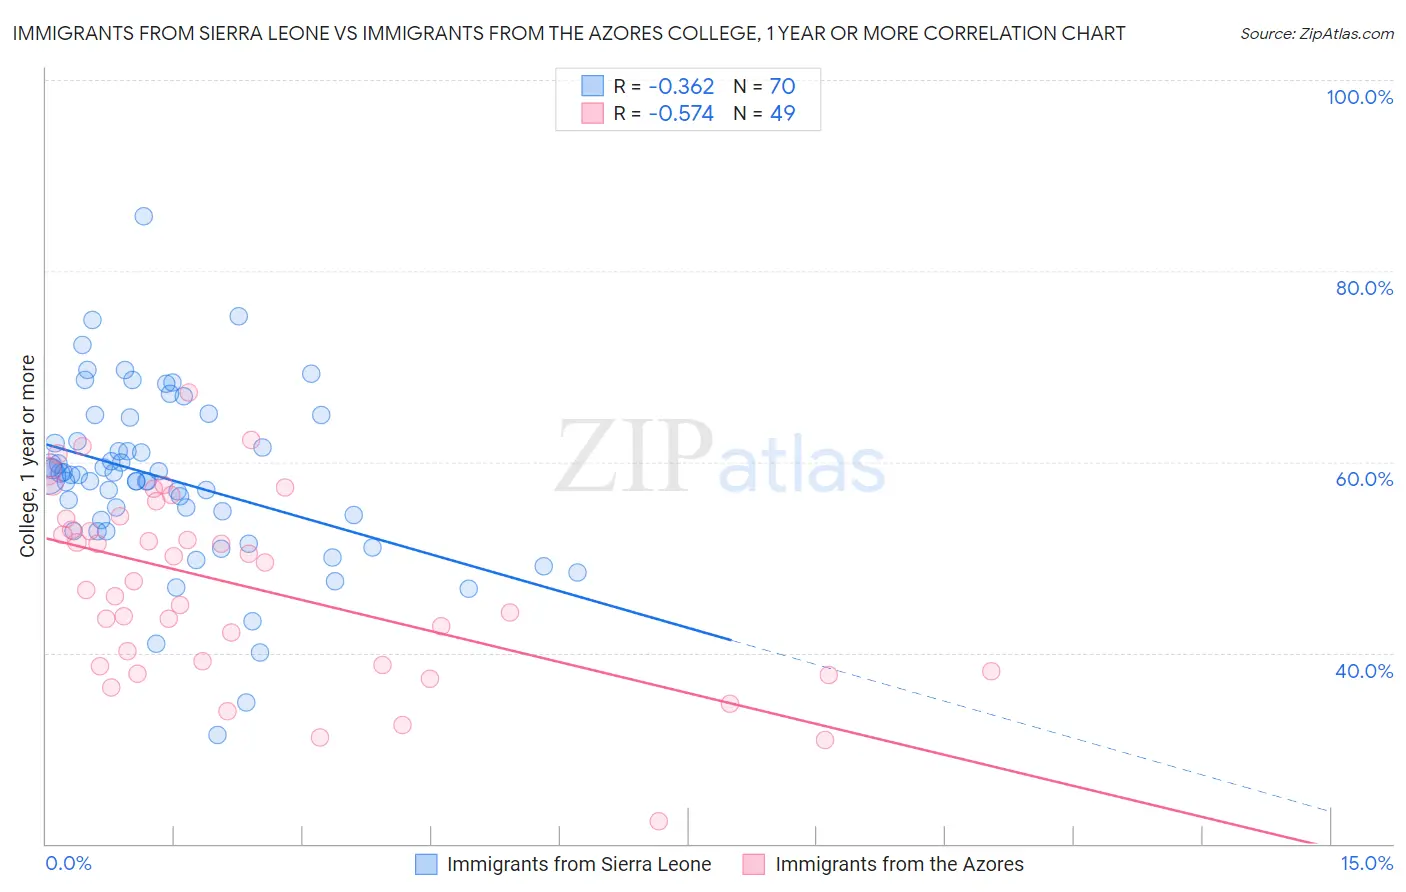
Immigrants from Sierra Leone vs Immigrants from the Azores College, 1 year or more Correlation Chart
The statistical analysis conducted on geographies consisting of 101,652,497 people shows a mild negative correlation between the proportion of Immigrants from Sierra Leone and percentage of population with at least college, 1 year or more education in the United States with a correlation coefficient (R) of -0.362 and weighted average of 59.5%. Similarly, the statistical analysis conducted on geographies consisting of 46,257,310 people shows a substantial negative correlation between the proportion of Immigrants from the Azores and percentage of population with at least college, 1 year or more education in the United States with a correlation coefficient (R) of -0.574 and weighted average of 48.4%, a difference of 23.0%.
College, 1 year or more Correlation Summary
| Measurement | Immigrants from Sierra Leone | Immigrants from the Azores |
| Minimum | 31.4% | 22.4% |
| Maximum | 85.8% | 67.3% |
| Range | 54.4% | 44.9% |
| Mean | 58.1% | 47.0% |
| Median | 58.6% | 47.5% |
| Interquartile 25% (IQ1) | 52.7% | 38.7% |
| Interquartile 75% (IQ3) | 62.1% | 54.2% |
| Interquartile Range (IQR) | 9.4% | 15.5% |
| Standard Deviation (Sample) | 9.2% | 9.8% |
| Standard Deviation (Population) | 9.2% | 9.7% |
Similar Demographics by College, 1 year or more
Demographics Similar to Immigrants from Sierra Leone by College, 1 year or more
In terms of college, 1 year or more, the demographic groups most similar to Immigrants from Sierra Leone are Welsh (59.5%, a difference of 0.010%), Immigrants from Albania (59.5%, a difference of 0.010%), Immigrants from Southern Europe (59.5%, a difference of 0.030%), Hungarian (59.5%, a difference of 0.040%), and Immigrants from North Macedonia (59.5%, a difference of 0.050%).
| Demographics | Rating | Rank | College, 1 year or more |
| Irish | 56.1 /100 | #165 | Average 59.6% |
| Immigrants | Africa | 56.1 /100 | #166 | Average 59.6% |
| Immigrants | North Macedonia | 53.1 /100 | #167 | Average 59.5% |
| Hungarians | 52.9 /100 | #168 | Average 59.5% |
| Immigrants | Southern Europe | 52.7 /100 | #169 | Average 59.5% |
| Welsh | 52.4 /100 | #170 | Average 59.5% |
| Immigrants | Albania | 52.3 /100 | #171 | Average 59.5% |
| Immigrants | Sierra Leone | 52.2 /100 | #172 | Average 59.5% |
| Immigrants | Oceania | 51.2 /100 | #173 | Average 59.4% |
| Celtics | 50.0 /100 | #174 | Average 59.4% |
| Sri Lankans | 49.0 /100 | #175 | Average 59.4% |
| Immigrants | Poland | 48.9 /100 | #176 | Average 59.4% |
| Tlingit-Haida | 48.4 /100 | #177 | Average 59.4% |
| Czechoslovakians | 48.3 /100 | #178 | Average 59.4% |
| Bermudans | 46.6 /100 | #179 | Average 59.3% |
Demographics Similar to Immigrants from the Azores by College, 1 year or more
In terms of college, 1 year or more, the demographic groups most similar to Immigrants from the Azores are Immigrants from Central America (48.5%, a difference of 0.26%), Pennsylvania German (48.5%, a difference of 0.31%), Spanish American Indian (48.5%, a difference of 0.32%), Immigrants from Cabo Verde (48.1%, a difference of 0.57%), and Yuman (48.7%, a difference of 0.76%).
| Demographics | Rating | Rank | College, 1 year or more |
| Mexicans | 0.0 /100 | #332 | Tragic 49.2% |
| Immigrants | Dominican Republic | 0.0 /100 | #333 | Tragic 49.1% |
| Lumbee | 0.0 /100 | #334 | Tragic 48.9% |
| Yuman | 0.0 /100 | #335 | Tragic 48.7% |
| Spanish American Indians | 0.0 /100 | #336 | Tragic 48.5% |
| Pennsylvania Germans | 0.0 /100 | #337 | Tragic 48.5% |
| Immigrants | Central America | 0.0 /100 | #338 | Tragic 48.5% |
| Immigrants | Azores | 0.0 /100 | #339 | Tragic 48.4% |
| Immigrants | Cabo Verde | 0.0 /100 | #340 | Tragic 48.1% |
| Immigrants | Mexico | 0.0 /100 | #341 | Tragic 47.5% |
| Inupiat | 0.0 /100 | #342 | Tragic 47.2% |
| Tohono O'odham | 0.0 /100 | #343 | Tragic 47.1% |
| Yakama | 0.0 /100 | #344 | Tragic 46.2% |
| Pima | 0.0 /100 | #345 | Tragic 45.6% |
| Houma | 0.0 /100 | #346 | Tragic 41.2% |