Immigrants from Sierra Leone vs Kiowa College, 1 year or more
COMPARE
Immigrants from Sierra Leone
Kiowa
College, 1 year or more
College, 1 year or more Comparison
Immigrants from Sierra Leone
Kiowa
59.5%
COLLEGE, 1 YEAR OR MORE
52.2/ 100
METRIC RATING
172nd/ 347
METRIC RANK
51.0%
COLLEGE, 1 YEAR OR MORE
0.0/ 100
METRIC RATING
320th/ 347
METRIC RANK
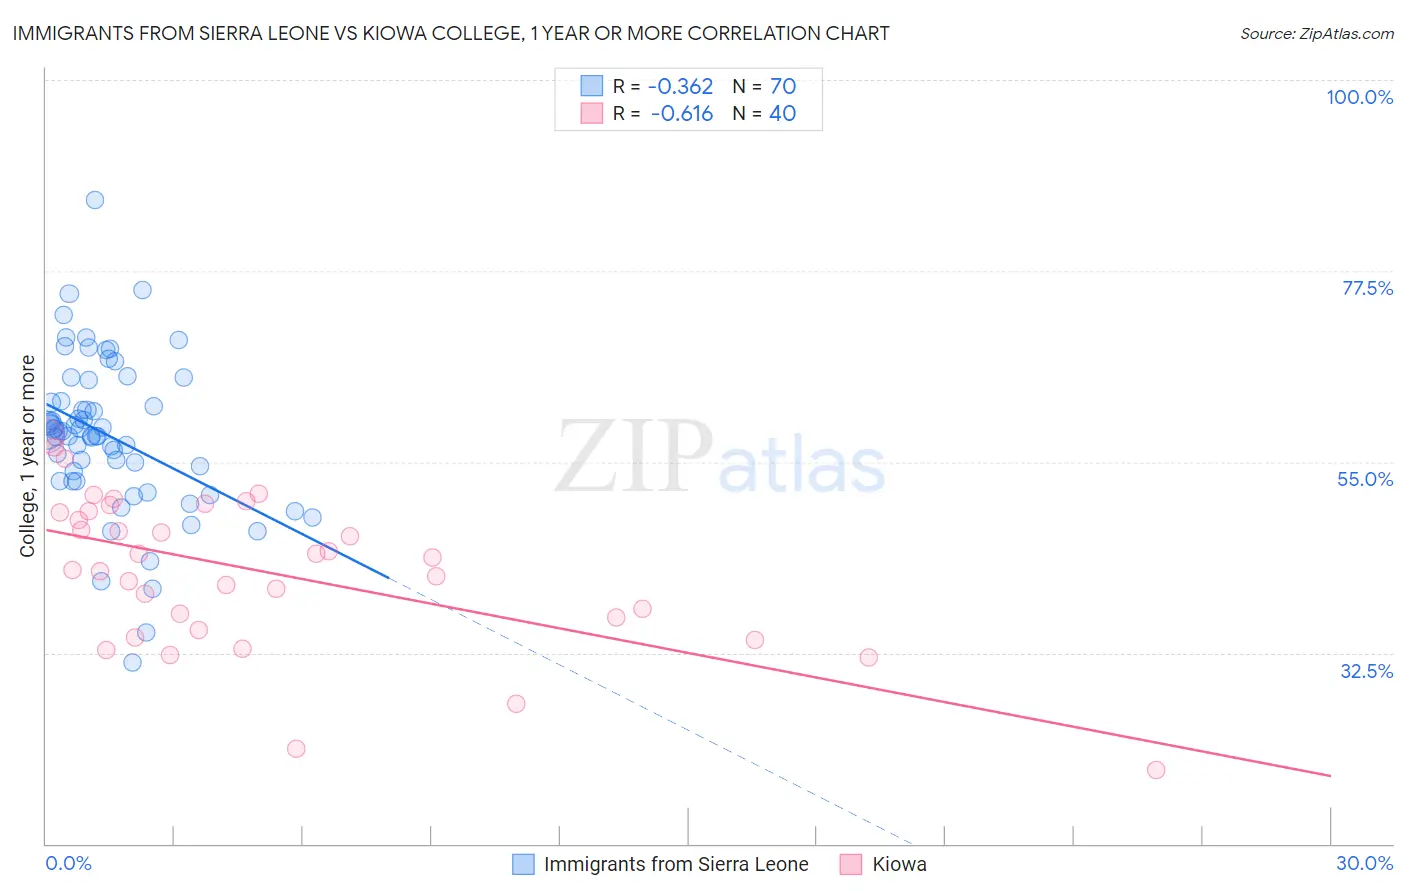
Immigrants from Sierra Leone vs Kiowa College, 1 year or more Correlation Chart
The statistical analysis conducted on geographies consisting of 101,652,497 people shows a mild negative correlation between the proportion of Immigrants from Sierra Leone and percentage of population with at least college, 1 year or more education in the United States with a correlation coefficient (R) of -0.362 and weighted average of 59.5%. Similarly, the statistical analysis conducted on geographies consisting of 56,101,444 people shows a significant negative correlation between the proportion of Kiowa and percentage of population with at least college, 1 year or more education in the United States with a correlation coefficient (R) of -0.616 and weighted average of 51.0%, a difference of 16.7%.
College, 1 year or more Correlation Summary
| Measurement | Immigrants from Sierra Leone | Kiowa |
| Minimum | 31.4% | 18.8% |
| Maximum | 85.8% | 58.1% |
| Range | 54.4% | 39.3% |
| Mean | 58.1% | 42.0% |
| Median | 58.6% | 43.0% |
| Interquartile 25% (IQ1) | 52.7% | 35.9% |
| Interquartile 75% (IQ3) | 62.1% | 49.1% |
| Interquartile Range (IQR) | 9.4% | 13.2% |
| Standard Deviation (Sample) | 9.2% | 9.0% |
| Standard Deviation (Population) | 9.2% | 8.9% |
Similar Demographics by College, 1 year or more
Demographics Similar to Immigrants from Sierra Leone by College, 1 year or more
In terms of college, 1 year or more, the demographic groups most similar to Immigrants from Sierra Leone are Welsh (59.5%, a difference of 0.010%), Immigrants from Albania (59.5%, a difference of 0.010%), Immigrants from Southern Europe (59.5%, a difference of 0.030%), Hungarian (59.5%, a difference of 0.040%), and Immigrants from North Macedonia (59.5%, a difference of 0.050%).
| Demographics | Rating | Rank | College, 1 year or more |
| Irish | 56.1 /100 | #165 | Average 59.6% |
| Immigrants | Africa | 56.1 /100 | #166 | Average 59.6% |
| Immigrants | North Macedonia | 53.1 /100 | #167 | Average 59.5% |
| Hungarians | 52.9 /100 | #168 | Average 59.5% |
| Immigrants | Southern Europe | 52.7 /100 | #169 | Average 59.5% |
| Welsh | 52.4 /100 | #170 | Average 59.5% |
| Immigrants | Albania | 52.3 /100 | #171 | Average 59.5% |
| Immigrants | Sierra Leone | 52.2 /100 | #172 | Average 59.5% |
| Immigrants | Oceania | 51.2 /100 | #173 | Average 59.4% |
| Celtics | 50.0 /100 | #174 | Average 59.4% |
| Sri Lankans | 49.0 /100 | #175 | Average 59.4% |
| Immigrants | Poland | 48.9 /100 | #176 | Average 59.4% |
| Tlingit-Haida | 48.4 /100 | #177 | Average 59.4% |
| Czechoslovakians | 48.3 /100 | #178 | Average 59.4% |
| Bermudans | 46.6 /100 | #179 | Average 59.3% |
Demographics Similar to Kiowa by College, 1 year or more
In terms of college, 1 year or more, the demographic groups most similar to Kiowa are Immigrants from El Salvador (51.0%, a difference of 0.060%), Hopi (50.9%, a difference of 0.12%), Immigrants from Honduras (51.0%, a difference of 0.15%), Hispanic or Latino (51.1%, a difference of 0.28%), and Navajo (50.8%, a difference of 0.31%).
| Demographics | Rating | Rank | College, 1 year or more |
| Immigrants | Caribbean | 0.0 /100 | #313 | Tragic 51.4% |
| Fijians | 0.0 /100 | #314 | Tragic 51.3% |
| Guatemalans | 0.0 /100 | #315 | Tragic 51.2% |
| Cajuns | 0.0 /100 | #316 | Tragic 51.2% |
| Hispanics or Latinos | 0.0 /100 | #317 | Tragic 51.1% |
| Immigrants | Honduras | 0.0 /100 | #318 | Tragic 51.0% |
| Immigrants | El Salvador | 0.0 /100 | #319 | Tragic 51.0% |
| Kiowa | 0.0 /100 | #320 | Tragic 51.0% |
| Hopi | 0.0 /100 | #321 | Tragic 50.9% |
| Navajo | 0.0 /100 | #322 | Tragic 50.8% |
| Immigrants | Guatemala | 0.0 /100 | #323 | Tragic 50.7% |
| Immigrants | Cuba | 0.0 /100 | #324 | Tragic 50.7% |
| Immigrants | Latin America | 0.0 /100 | #325 | Tragic 50.7% |
| Dominicans | 0.0 /100 | #326 | Tragic 50.6% |
| Menominee | 0.0 /100 | #327 | Tragic 50.6% |