Immigrants from Sierra Leone vs Slovak College, 1 year or more
COMPARE
Immigrants from Sierra Leone
Slovak
College, 1 year or more
College, 1 year or more Comparison
Immigrants from Sierra Leone
Slovaks
59.5%
COLLEGE, 1 YEAR OR MORE
52.2/ 100
METRIC RATING
172nd/ 347
METRIC RANK
58.5%
COLLEGE, 1 YEAR OR MORE
24.6/ 100
METRIC RATING
199th/ 347
METRIC RANK
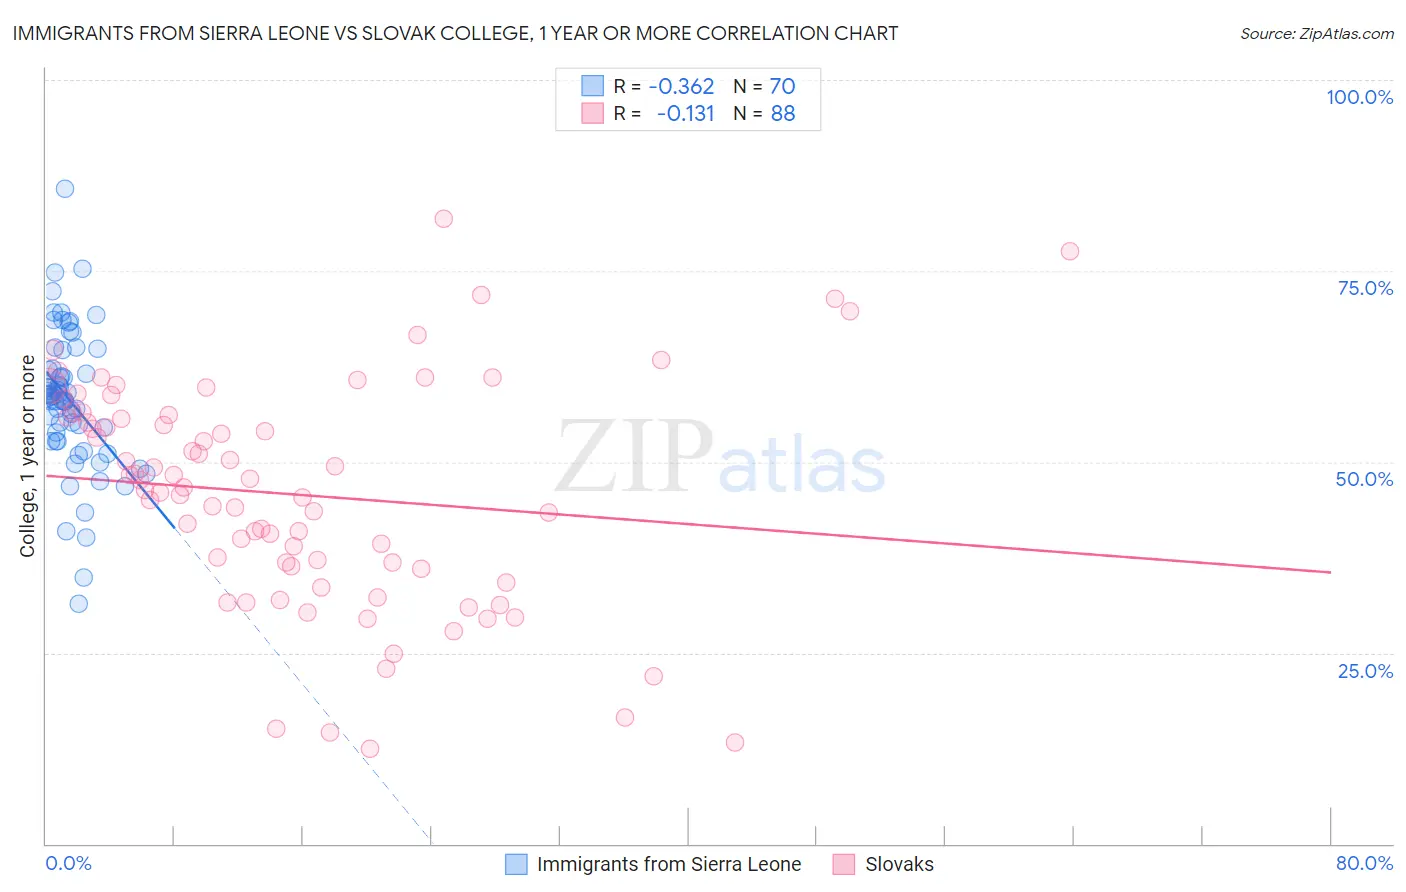
Immigrants from Sierra Leone vs Slovak College, 1 year or more Correlation Chart
The statistical analysis conducted on geographies consisting of 101,652,497 people shows a mild negative correlation between the proportion of Immigrants from Sierra Leone and percentage of population with at least college, 1 year or more education in the United States with a correlation coefficient (R) of -0.362 and weighted average of 59.5%. Similarly, the statistical analysis conducted on geographies consisting of 397,891,392 people shows a poor negative correlation between the proportion of Slovaks and percentage of population with at least college, 1 year or more education in the United States with a correlation coefficient (R) of -0.131 and weighted average of 58.5%, a difference of 1.6%.
College, 1 year or more Correlation Summary
| Measurement | Immigrants from Sierra Leone | Slovak |
| Minimum | 31.4% | 12.5% |
| Maximum | 85.8% | 81.8% |
| Range | 54.4% | 69.3% |
| Mean | 58.1% | 45.7% |
| Median | 58.6% | 46.4% |
| Interquartile 25% (IQ1) | 52.7% | 36.1% |
| Interquartile 75% (IQ3) | 62.1% | 55.9% |
| Interquartile Range (IQR) | 9.4% | 19.8% |
| Standard Deviation (Sample) | 9.2% | 14.7% |
| Standard Deviation (Population) | 9.2% | 14.6% |
Similar Demographics by College, 1 year or more
Demographics Similar to Immigrants from Sierra Leone by College, 1 year or more
In terms of college, 1 year or more, the demographic groups most similar to Immigrants from Sierra Leone are Welsh (59.5%, a difference of 0.010%), Immigrants from Albania (59.5%, a difference of 0.010%), Immigrants from Southern Europe (59.5%, a difference of 0.030%), Hungarian (59.5%, a difference of 0.040%), and Immigrants from North Macedonia (59.5%, a difference of 0.050%).
| Demographics | Rating | Rank | College, 1 year or more |
| Irish | 56.1 /100 | #165 | Average 59.6% |
| Immigrants | Africa | 56.1 /100 | #166 | Average 59.6% |
| Immigrants | North Macedonia | 53.1 /100 | #167 | Average 59.5% |
| Hungarians | 52.9 /100 | #168 | Average 59.5% |
| Immigrants | Southern Europe | 52.7 /100 | #169 | Average 59.5% |
| Welsh | 52.4 /100 | #170 | Average 59.5% |
| Immigrants | Albania | 52.3 /100 | #171 | Average 59.5% |
| Immigrants | Sierra Leone | 52.2 /100 | #172 | Average 59.5% |
| Immigrants | Oceania | 51.2 /100 | #173 | Average 59.4% |
| Celtics | 50.0 /100 | #174 | Average 59.4% |
| Sri Lankans | 49.0 /100 | #175 | Average 59.4% |
| Immigrants | Poland | 48.9 /100 | #176 | Average 59.4% |
| Tlingit-Haida | 48.4 /100 | #177 | Average 59.4% |
| Czechoslovakians | 48.3 /100 | #178 | Average 59.4% |
| Bermudans | 46.6 /100 | #179 | Average 59.3% |
Demographics Similar to Slovaks by College, 1 year or more
In terms of college, 1 year or more, the demographic groups most similar to Slovaks are Spanish (58.5%, a difference of 0.030%), Immigrants from South Eastern Asia (58.5%, a difference of 0.040%), Immigrants from Thailand (58.6%, a difference of 0.10%), Dutch (58.6%, a difference of 0.11%), and Guamanian/Chamorro (58.6%, a difference of 0.11%).
| Demographics | Rating | Rank | College, 1 year or more |
| Colombians | 27.6 /100 | #192 | Fair 58.7% |
| Peruvians | 27.5 /100 | #193 | Fair 58.6% |
| Costa Ricans | 26.4 /100 | #194 | Fair 58.6% |
| Dutch | 26.2 /100 | #195 | Fair 58.6% |
| Guamanians/Chamorros | 26.2 /100 | #196 | Fair 58.6% |
| Immigrants | Thailand | 26.0 /100 | #197 | Fair 58.6% |
| Immigrants | South Eastern Asia | 25.1 /100 | #198 | Fair 58.5% |
| Slovaks | 24.6 /100 | #199 | Fair 58.5% |
| Spanish | 24.2 /100 | #200 | Fair 58.5% |
| Nigerians | 23.0 /100 | #201 | Fair 58.5% |
| Immigrants | South America | 21.9 /100 | #202 | Fair 58.4% |
| Ghanaians | 20.9 /100 | #203 | Fair 58.4% |
| Panamanians | 19.2 /100 | #204 | Poor 58.3% |
| Immigrants | Zaire | 18.7 /100 | #205 | Poor 58.3% |
| Immigrants | Vietnam | 18.2 /100 | #206 | Poor 58.2% |