Immigrants from Costa Rica vs Immigrants from the Azores College, 1 year or more
COMPARE
Immigrants from Costa Rica
Immigrants from the Azores
College, 1 year or more
College, 1 year or more Comparison
Immigrants from Costa Rica
Immigrants from the Azores
57.5%
COLLEGE, 1 YEAR OR MORE
8.0/ 100
METRIC RATING
220th/ 347
METRIC RANK
48.4%
COLLEGE, 1 YEAR OR MORE
0.0/ 100
METRIC RATING
339th/ 347
METRIC RANK
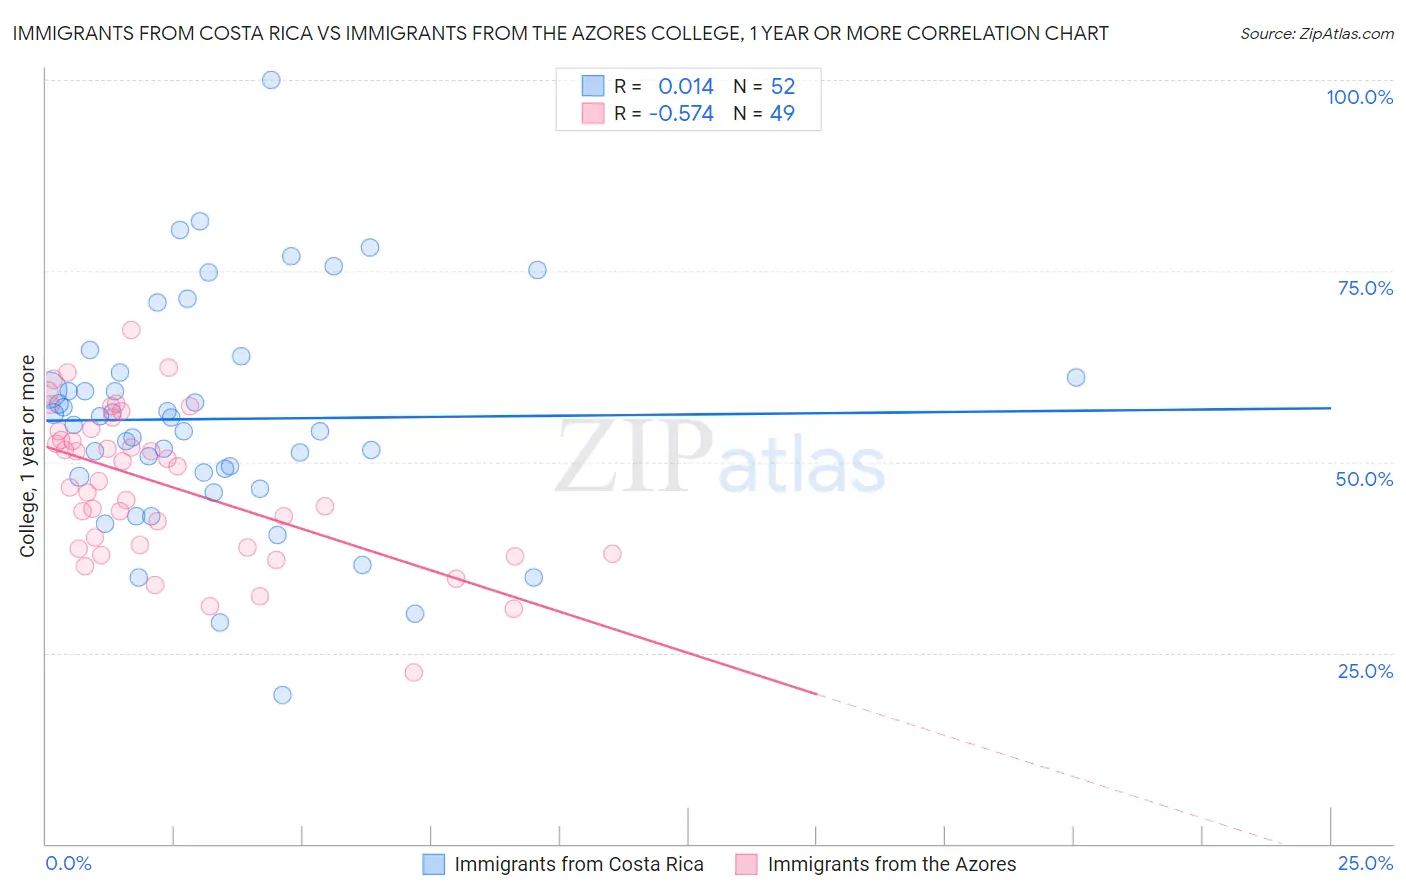
Immigrants from Costa Rica vs Immigrants from the Azores College, 1 year or more Correlation Chart
The statistical analysis conducted on geographies consisting of 204,277,408 people shows no correlation between the proportion of Immigrants from Costa Rica and percentage of population with at least college, 1 year or more education in the United States with a correlation coefficient (R) of 0.014 and weighted average of 57.5%. Similarly, the statistical analysis conducted on geographies consisting of 46,257,310 people shows a substantial negative correlation between the proportion of Immigrants from the Azores and percentage of population with at least college, 1 year or more education in the United States with a correlation coefficient (R) of -0.574 and weighted average of 48.4%, a difference of 18.9%.
College, 1 year or more Correlation Summary
| Measurement | Immigrants from Costa Rica | Immigrants from the Azores |
| Minimum | 19.5% | 22.4% |
| Maximum | 100.0% | 67.3% |
| Range | 80.5% | 44.9% |
| Mean | 55.6% | 47.0% |
| Median | 55.4% | 47.5% |
| Interquartile 25% (IQ1) | 48.3% | 38.7% |
| Interquartile 75% (IQ3) | 61.4% | 54.2% |
| Interquartile Range (IQR) | 13.0% | 15.5% |
| Standard Deviation (Sample) | 14.8% | 9.8% |
| Standard Deviation (Population) | 14.7% | 9.7% |
Similar Demographics by College, 1 year or more
Demographics Similar to Immigrants from Costa Rica by College, 1 year or more
In terms of college, 1 year or more, the demographic groups most similar to Immigrants from Costa Rica are Immigrants from Ghana (57.4%, a difference of 0.070%), White/Caucasian (57.6%, a difference of 0.12%), Native Hawaiian (57.6%, a difference of 0.18%), Immigrants from Panama (57.6%, a difference of 0.19%), and Subsaharan African (57.3%, a difference of 0.41%).
| Demographics | Rating | Rank | College, 1 year or more |
| French Canadians | 11.8 /100 | #213 | Poor 57.8% |
| Immigrants | Colombia | 11.6 /100 | #214 | Poor 57.8% |
| Tongans | 11.6 /100 | #215 | Poor 57.8% |
| Immigrants | Peru | 10.6 /100 | #216 | Poor 57.7% |
| Immigrants | Panama | 9.1 /100 | #217 | Tragic 57.6% |
| Native Hawaiians | 9.0 /100 | #218 | Tragic 57.6% |
| Whites/Caucasians | 8.7 /100 | #219 | Tragic 57.6% |
| Immigrants | Costa Rica | 8.0 /100 | #220 | Tragic 57.5% |
| Immigrants | Ghana | 7.7 /100 | #221 | Tragic 57.4% |
| Sub-Saharan Africans | 6.1 /100 | #222 | Tragic 57.3% |
| Portuguese | 5.4 /100 | #223 | Tragic 57.2% |
| Hmong | 5.4 /100 | #224 | Tragic 57.2% |
| Vietnamese | 4.7 /100 | #225 | Tragic 57.0% |
| Immigrants | Western Africa | 4.6 /100 | #226 | Tragic 57.0% |
| Immigrants | Immigrants | 4.4 /100 | #227 | Tragic 57.0% |
Demographics Similar to Immigrants from the Azores by College, 1 year or more
In terms of college, 1 year or more, the demographic groups most similar to Immigrants from the Azores are Immigrants from Central America (48.5%, a difference of 0.26%), Pennsylvania German (48.5%, a difference of 0.31%), Spanish American Indian (48.5%, a difference of 0.32%), Immigrants from Cabo Verde (48.1%, a difference of 0.57%), and Yuman (48.7%, a difference of 0.76%).
| Demographics | Rating | Rank | College, 1 year or more |
| Mexicans | 0.0 /100 | #332 | Tragic 49.2% |
| Immigrants | Dominican Republic | 0.0 /100 | #333 | Tragic 49.1% |
| Lumbee | 0.0 /100 | #334 | Tragic 48.9% |
| Yuman | 0.0 /100 | #335 | Tragic 48.7% |
| Spanish American Indians | 0.0 /100 | #336 | Tragic 48.5% |
| Pennsylvania Germans | 0.0 /100 | #337 | Tragic 48.5% |
| Immigrants | Central America | 0.0 /100 | #338 | Tragic 48.5% |
| Immigrants | Azores | 0.0 /100 | #339 | Tragic 48.4% |
| Immigrants | Cabo Verde | 0.0 /100 | #340 | Tragic 48.1% |
| Immigrants | Mexico | 0.0 /100 | #341 | Tragic 47.5% |
| Inupiat | 0.0 /100 | #342 | Tragic 47.2% |
| Tohono O'odham | 0.0 /100 | #343 | Tragic 47.1% |
| Yakama | 0.0 /100 | #344 | Tragic 46.2% |
| Pima | 0.0 /100 | #345 | Tragic 45.6% |
| Houma | 0.0 /100 | #346 | Tragic 41.2% |