Immigrants from Senegal vs Immigrants from Sierra Leone GED/Equivalency
COMPARE
Immigrants from Senegal
Immigrants from Sierra Leone
GED/Equivalency
GED/Equivalency Comparison
Immigrants from Senegal
Immigrants from Sierra Leone
83.8%
GED/EQUIVALENCY
1.2/ 100
METRIC RATING
245th/ 347
METRIC RANK
85.4%
GED/EQUIVALENCY
29.0/ 100
METRIC RATING
188th/ 347
METRIC RANK
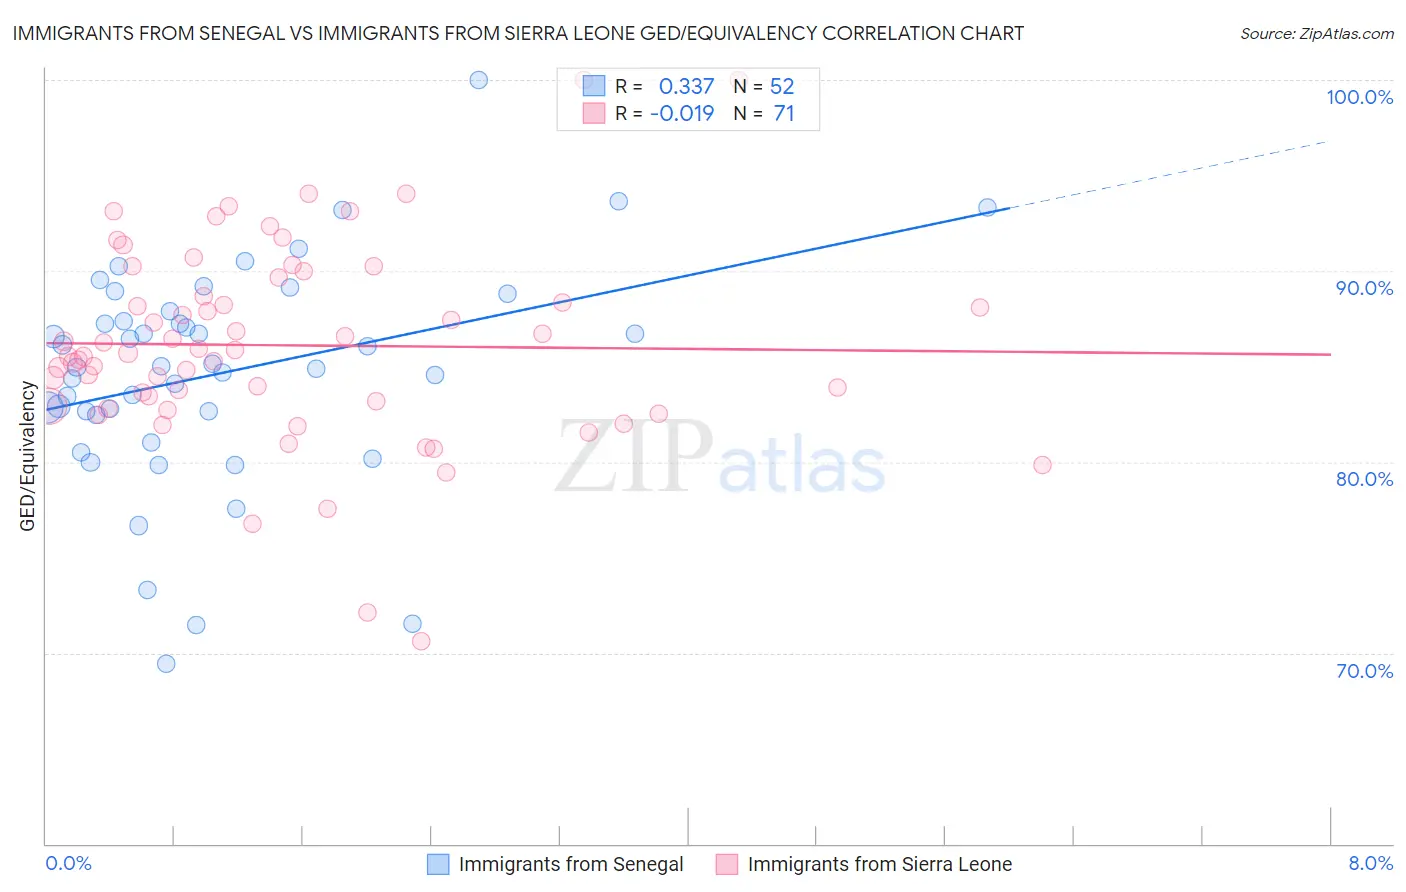
Immigrants from Senegal vs Immigrants from Sierra Leone GED/Equivalency Correlation Chart
The statistical analysis conducted on geographies consisting of 90,130,297 people shows a mild positive correlation between the proportion of Immigrants from Senegal and percentage of population with at least ged/equivalency education in the United States with a correlation coefficient (R) of 0.337 and weighted average of 83.8%. Similarly, the statistical analysis conducted on geographies consisting of 101,654,421 people shows no correlation between the proportion of Immigrants from Sierra Leone and percentage of population with at least ged/equivalency education in the United States with a correlation coefficient (R) of -0.019 and weighted average of 85.4%, a difference of 1.8%.
GED/Equivalency Correlation Summary
| Measurement | Immigrants from Senegal | Immigrants from Sierra Leone |
| Minimum | 69.5% | 70.6% |
| Maximum | 100.0% | 100.0% |
| Range | 30.5% | 29.4% |
| Mean | 84.7% | 86.1% |
| Median | 85.0% | 85.7% |
| Interquartile 25% (IQ1) | 82.5% | 82.9% |
| Interquartile 75% (IQ3) | 87.6% | 89.6% |
| Interquartile Range (IQR) | 5.1% | 6.7% |
| Standard Deviation (Sample) | 5.8% | 5.2% |
| Standard Deviation (Population) | 5.7% | 5.2% |
Similar Demographics by GED/Equivalency
Demographics Similar to Immigrants from Senegal by GED/Equivalency
In terms of ged/equivalency, the demographic groups most similar to Immigrants from Senegal are Chickasaw (83.8%, a difference of 0.020%), Immigrants from Ghana (83.9%, a difference of 0.030%), Cherokee (83.9%, a difference of 0.040%), Immigrants from Western Africa (83.8%, a difference of 0.050%), and Blackfeet (83.8%, a difference of 0.070%).
| Demographics | Rating | Rank | GED/Equivalency |
| Immigrants | Peru | 2.7 /100 | #238 | Tragic 84.2% |
| Immigrants | Bahamas | 2.6 /100 | #239 | Tragic 84.2% |
| Immigrants | South Eastern Asia | 2.5 /100 | #240 | Tragic 84.1% |
| Senegalese | 1.9 /100 | #241 | Tragic 84.0% |
| Sri Lankans | 1.9 /100 | #242 | Tragic 84.0% |
| Cherokee | 1.3 /100 | #243 | Tragic 83.9% |
| Immigrants | Ghana | 1.3 /100 | #244 | Tragic 83.9% |
| Immigrants | Senegal | 1.2 /100 | #245 | Tragic 83.8% |
| Chickasaw | 1.2 /100 | #246 | Tragic 83.8% |
| Immigrants | Western Africa | 1.1 /100 | #247 | Tragic 83.8% |
| Blackfeet | 1.1 /100 | #248 | Tragic 83.8% |
| Crow | 1.1 /100 | #249 | Tragic 83.8% |
| Shoshone | 1.0 /100 | #250 | Tragic 83.7% |
| Spanish Americans | 0.8 /100 | #251 | Tragic 83.6% |
| Bahamians | 0.8 /100 | #252 | Tragic 83.6% |
Demographics Similar to Immigrants from Sierra Leone by GED/Equivalency
In terms of ged/equivalency, the demographic groups most similar to Immigrants from Sierra Leone are Guamanian/Chamorro (85.3%, a difference of 0.010%), Immigrants from Afghanistan (85.4%, a difference of 0.020%), Alaskan Athabascan (85.3%, a difference of 0.040%), Spaniard (85.4%, a difference of 0.070%), and Spanish (85.4%, a difference of 0.090%).
| Demographics | Rating | Rank | GED/Equivalency |
| Moroccans | 37.7 /100 | #181 | Fair 85.5% |
| Sudanese | 35.2 /100 | #182 | Fair 85.5% |
| Immigrants | Sudan | 34.2 /100 | #183 | Fair 85.5% |
| Immigrants | Oceania | 33.6 /100 | #184 | Fair 85.5% |
| Spanish | 32.8 /100 | #185 | Fair 85.4% |
| Spaniards | 31.9 /100 | #186 | Fair 85.4% |
| Immigrants | Afghanistan | 29.8 /100 | #187 | Fair 85.4% |
| Immigrants | Sierra Leone | 29.0 /100 | #188 | Fair 85.4% |
| Guamanians/Chamorros | 28.4 /100 | #189 | Fair 85.3% |
| Alaskan Athabascans | 27.5 /100 | #190 | Fair 85.3% |
| South American Indians | 22.8 /100 | #191 | Fair 85.2% |
| Immigrants | Nonimmigrants | 22.7 /100 | #192 | Fair 85.2% |
| Delaware | 22.2 /100 | #193 | Fair 85.2% |
| Puget Sound Salish | 20.8 /100 | #194 | Fair 85.2% |
| Chippewa | 20.8 /100 | #195 | Fair 85.2% |