Immigrants from Senegal vs Immigrants from Nepal 7th Grade
COMPARE
Immigrants from Senegal
Immigrants from Nepal
7th Grade
7th Grade Comparison
Immigrants from Senegal
Immigrants from Nepal
95.5%
7TH GRADE
1.9/ 100
METRIC RATING
242nd/ 347
METRIC RANK
95.9%
7TH GRADE
30.0/ 100
METRIC RATING
194th/ 347
METRIC RANK
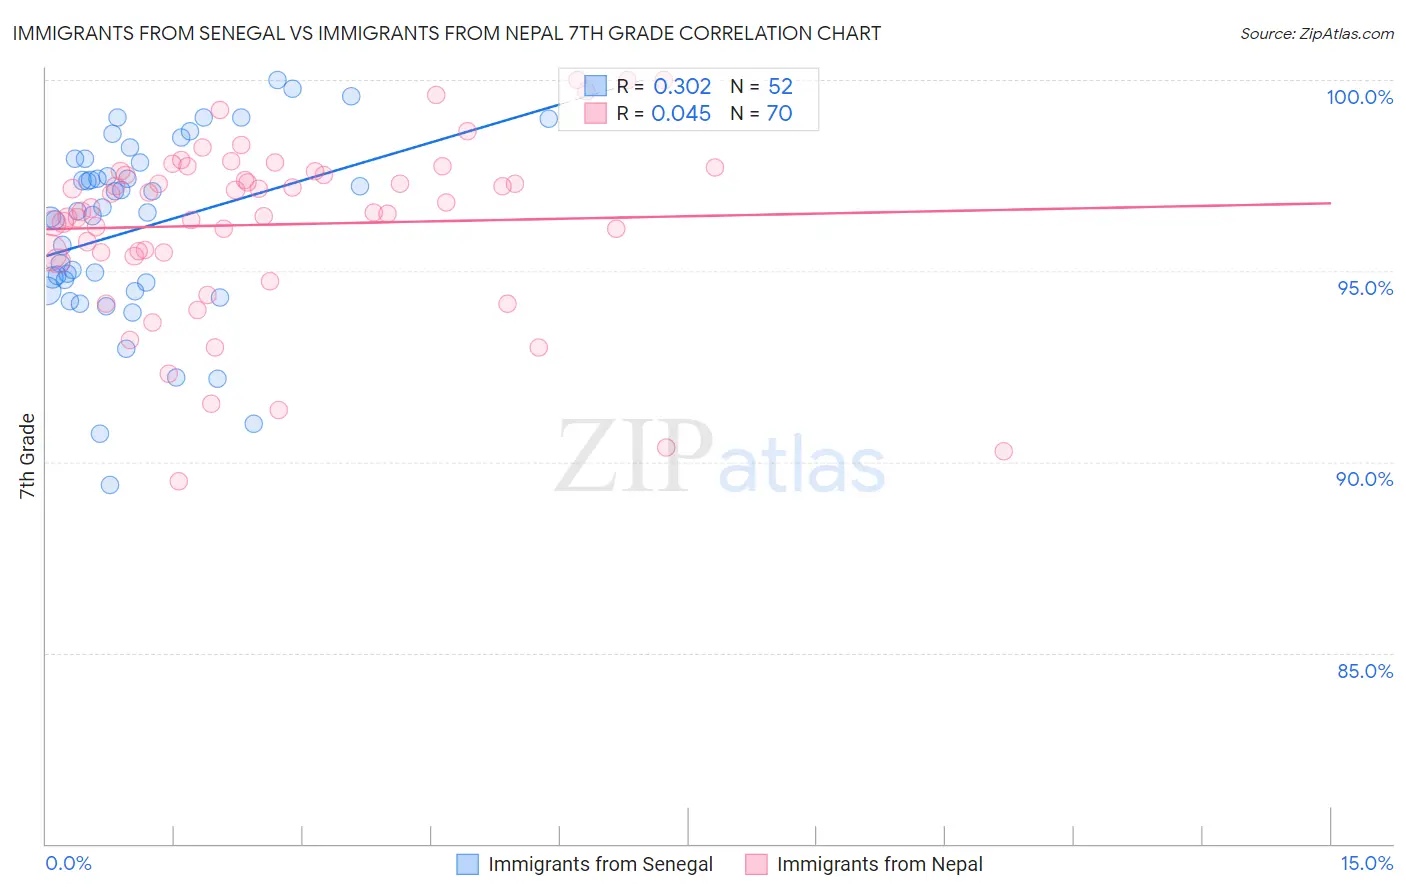
Immigrants from Senegal vs Immigrants from Nepal 7th Grade Correlation Chart
The statistical analysis conducted on geographies consisting of 90,130,297 people shows a mild positive correlation between the proportion of Immigrants from Senegal and percentage of population with at least 7th grade education in the United States with a correlation coefficient (R) of 0.302 and weighted average of 95.5%. Similarly, the statistical analysis conducted on geographies consisting of 186,622,433 people shows no correlation between the proportion of Immigrants from Nepal and percentage of population with at least 7th grade education in the United States with a correlation coefficient (R) of 0.045 and weighted average of 95.9%, a difference of 0.48%.
7th Grade Correlation Summary
| Measurement | Immigrants from Senegal | Immigrants from Nepal |
| Minimum | 89.4% | 89.5% |
| Maximum | 100.0% | 100.0% |
| Range | 10.6% | 10.5% |
| Mean | 96.1% | 96.2% |
| Median | 96.6% | 96.6% |
| Interquartile 25% (IQ1) | 94.6% | 95.5% |
| Interquartile 75% (IQ3) | 97.9% | 97.6% |
| Interquartile Range (IQR) | 3.3% | 2.1% |
| Standard Deviation (Sample) | 2.4% | 2.3% |
| Standard Deviation (Population) | 2.4% | 2.3% |
Similar Demographics by 7th Grade
Demographics Similar to Immigrants from Senegal by 7th Grade
In terms of 7th grade, the demographic groups most similar to Immigrants from Senegal are Immigrants from Sierra Leone (95.5%, a difference of 0.0%), South American Indian (95.5%, a difference of 0.0%), Jamaican (95.5%, a difference of 0.020%), U.S. Virgin Islander (95.4%, a difference of 0.020%), and Immigrants from Asia (95.5%, a difference of 0.030%).
| Demographics | Rating | Rank | 7th Grade |
| Immigrants | Africa | 2.7 /100 | #235 | Tragic 95.5% |
| Asians | 2.6 /100 | #236 | Tragic 95.5% |
| Immigrants | Asia | 2.3 /100 | #237 | Tragic 95.5% |
| Indians (Asian) | 2.3 /100 | #238 | Tragic 95.5% |
| Jamaicans | 2.2 /100 | #239 | Tragic 95.5% |
| Immigrants | Sierra Leone | 2.0 /100 | #240 | Tragic 95.5% |
| South American Indians | 2.0 /100 | #241 | Tragic 95.5% |
| Immigrants | Senegal | 1.9 /100 | #242 | Tragic 95.5% |
| U.S. Virgin Islanders | 1.6 /100 | #243 | Tragic 95.4% |
| Uruguayans | 1.6 /100 | #244 | Tragic 95.4% |
| Immigrants | Middle Africa | 1.5 /100 | #245 | Tragic 95.4% |
| Ethiopians | 1.5 /100 | #246 | Tragic 95.4% |
| Tongans | 1.3 /100 | #247 | Tragic 95.4% |
| Paiute | 1.2 /100 | #248 | Tragic 95.4% |
| Bolivians | 1.1 /100 | #249 | Tragic 95.4% |
Demographics Similar to Immigrants from Nepal by 7th Grade
In terms of 7th grade, the demographic groups most similar to Immigrants from Nepal are Immigrants from Bahamas (95.9%, a difference of 0.010%), Sudanese (95.9%, a difference of 0.010%), Immigrants from Micronesia (95.9%, a difference of 0.020%), Liberian (95.9%, a difference of 0.020%), and Panamanian (95.9%, a difference of 0.020%).
| Demographics | Rating | Rank | 7th Grade |
| Immigrants | Uganda | 36.0 /100 | #187 | Fair 96.0% |
| Immigrants | Egypt | 34.3 /100 | #188 | Fair 95.9% |
| Immigrants | Venezuela | 33.9 /100 | #189 | Fair 95.9% |
| Immigrants | Micronesia | 32.6 /100 | #190 | Fair 95.9% |
| Liberians | 32.5 /100 | #191 | Fair 95.9% |
| Panamanians | 32.3 /100 | #192 | Fair 95.9% |
| Immigrants | Bahamas | 30.8 /100 | #193 | Fair 95.9% |
| Immigrants | Nepal | 30.0 /100 | #194 | Fair 95.9% |
| Sudanese | 28.1 /100 | #195 | Fair 95.9% |
| Apache | 27.6 /100 | #196 | Fair 95.9% |
| Immigrants | Zaire | 26.7 /100 | #197 | Fair 95.9% |
| Paraguayans | 24.8 /100 | #198 | Fair 95.9% |
| Guamanians/Chamorros | 23.5 /100 | #199 | Fair 95.9% |
| Argentineans | 23.2 /100 | #200 | Fair 95.9% |
| Immigrants | Argentina | 21.9 /100 | #201 | Fair 95.9% |