Immigrants from Senegal vs Scotch-Irish Female Unemployment
COMPARE
Immigrants from Senegal
Scotch-Irish
Female Unemployment
Female Unemployment Comparison
Immigrants from Senegal
Scotch-Irish
6.1%
FEMALE UNEMPLOYMENT
0.0/ 100
METRIC RATING
284th/ 347
METRIC RANK
4.8%
FEMALE UNEMPLOYMENT
99.6/ 100
METRIC RATING
39th/ 347
METRIC RANK
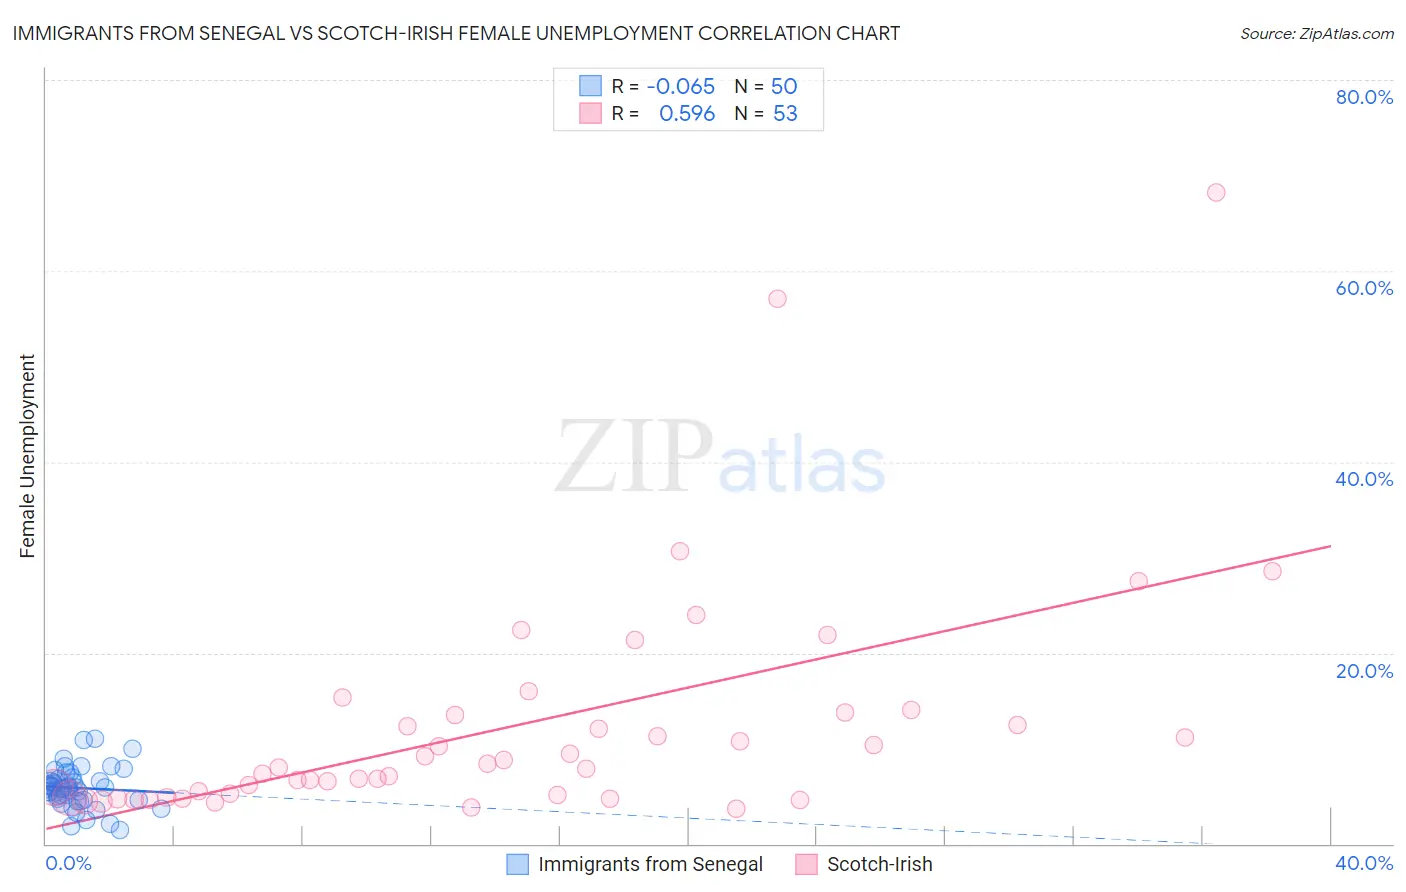
Immigrants from Senegal vs Scotch-Irish Female Unemployment Correlation Chart
The statistical analysis conducted on geographies consisting of 90,121,254 people shows a slight negative correlation between the proportion of Immigrants from Senegal and unemploymnet rate among females in the United States with a correlation coefficient (R) of -0.065 and weighted average of 6.1%. Similarly, the statistical analysis conducted on geographies consisting of 537,046,188 people shows a substantial positive correlation between the proportion of Scotch-Irish and unemploymnet rate among females in the United States with a correlation coefficient (R) of 0.596 and weighted average of 4.8%, a difference of 25.6%.
Female Unemployment Correlation Summary
| Measurement | Immigrants from Senegal | Scotch-Irish |
| Minimum | 1.4% | 3.7% |
| Maximum | 11.0% | 68.2% |
| Range | 9.6% | 64.5% |
| Mean | 5.8% | 12.3% |
| Median | 5.9% | 8.0% |
| Interquartile 25% (IQ1) | 4.6% | 5.0% |
| Interquartile 75% (IQ3) | 6.8% | 13.6% |
| Interquartile Range (IQR) | 2.2% | 8.7% |
| Standard Deviation (Sample) | 2.0% | 12.2% |
| Standard Deviation (Population) | 2.0% | 12.1% |
Similar Demographics by Female Unemployment
Demographics Similar to Immigrants from Senegal by Female Unemployment
In terms of female unemployment, the demographic groups most similar to Immigrants from Senegal are Salvadoran (6.0%, a difference of 0.34%), Immigrants from Cabo Verde (6.1%, a difference of 0.38%), Chippewa (6.1%, a difference of 0.40%), Immigrants from Guatemala (6.1%, a difference of 0.43%), and Colville (6.0%, a difference of 0.44%).
| Demographics | Rating | Rank | Female Unemployment |
| Immigrants | Ghana | 0.0 /100 | #277 | Tragic 6.0% |
| Yaqui | 0.0 /100 | #278 | Tragic 6.0% |
| Armenians | 0.0 /100 | #279 | Tragic 6.0% |
| Mexican American Indians | 0.0 /100 | #280 | Tragic 6.0% |
| Guatemalans | 0.0 /100 | #281 | Tragic 6.0% |
| Colville | 0.0 /100 | #282 | Tragic 6.0% |
| Salvadorans | 0.0 /100 | #283 | Tragic 6.0% |
| Immigrants | Senegal | 0.0 /100 | #284 | Tragic 6.1% |
| Immigrants | Cabo Verde | 0.0 /100 | #285 | Tragic 6.1% |
| Chippewa | 0.0 /100 | #286 | Tragic 6.1% |
| Immigrants | Guatemala | 0.0 /100 | #287 | Tragic 6.1% |
| Haitians | 0.0 /100 | #288 | Tragic 6.1% |
| Trinidadians and Tobagonians | 0.0 /100 | #289 | Tragic 6.1% |
| Immigrants | Caribbean | 0.0 /100 | #290 | Tragic 6.1% |
| Immigrants | West Indies | 0.0 /100 | #291 | Tragic 6.1% |
Demographics Similar to Scotch-Irish by Female Unemployment
In terms of female unemployment, the demographic groups most similar to Scotch-Irish are Northern European (4.8%, a difference of 0.010%), French (4.8%, a difference of 0.040%), Pennsylvania German (4.8%, a difference of 0.12%), Tongan (4.8%, a difference of 0.30%), and Italian (4.8%, a difference of 0.43%).
| Demographics | Rating | Rank | Female Unemployment |
| Slovaks | 99.8 /100 | #32 | Exceptional 4.8% |
| Czechoslovakians | 99.7 /100 | #33 | Exceptional 4.8% |
| Zimbabweans | 99.7 /100 | #34 | Exceptional 4.8% |
| French Canadians | 99.7 /100 | #35 | Exceptional 4.8% |
| Yugoslavians | 99.7 /100 | #36 | Exceptional 4.8% |
| Pennsylvania Germans | 99.6 /100 | #37 | Exceptional 4.8% |
| Northern Europeans | 99.6 /100 | #38 | Exceptional 4.8% |
| Scotch-Irish | 99.6 /100 | #39 | Exceptional 4.8% |
| French | 99.6 /100 | #40 | Exceptional 4.8% |
| Tongans | 99.5 /100 | #41 | Exceptional 4.8% |
| Italians | 99.5 /100 | #42 | Exceptional 4.8% |
| Eastern Europeans | 99.4 /100 | #43 | Exceptional 4.9% |
| Greeks | 99.4 /100 | #44 | Exceptional 4.9% |
| Austrians | 99.3 /100 | #45 | Exceptional 4.9% |
| Immigrants | Bulgaria | 99.3 /100 | #46 | Exceptional 4.9% |