Immigrants from Senegal vs Filipino College, 1 year or more
COMPARE
Immigrants from Senegal
Filipino
College, 1 year or more
College, 1 year or more Comparison
Immigrants from Senegal
Filipinos
57.8%
COLLEGE, 1 YEAR OR MORE
11.8/ 100
METRIC RATING
212th/ 347
METRIC RANK
71.0%
COLLEGE, 1 YEAR OR MORE
100.0/ 100
METRIC RATING
1st/ 347
METRIC RANK
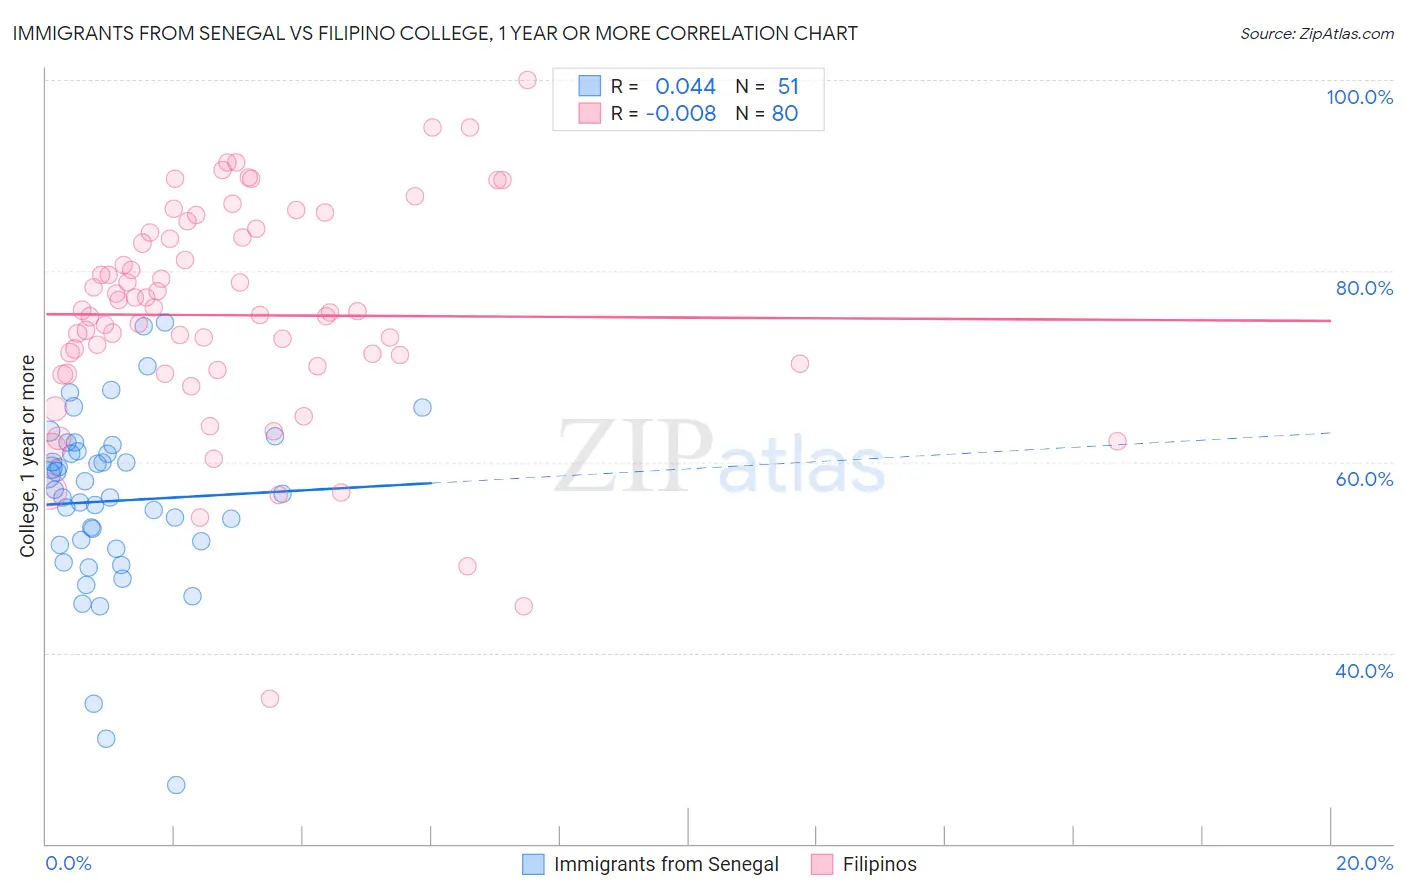
Immigrants from Senegal vs Filipino College, 1 year or more Correlation Chart
The statistical analysis conducted on geographies consisting of 90,129,295 people shows no correlation between the proportion of Immigrants from Senegal and percentage of population with at least college, 1 year or more education in the United States with a correlation coefficient (R) of 0.044 and weighted average of 57.8%. Similarly, the statistical analysis conducted on geographies consisting of 254,347,704 people shows no correlation between the proportion of Filipinos and percentage of population with at least college, 1 year or more education in the United States with a correlation coefficient (R) of -0.008 and weighted average of 71.0%, a difference of 22.8%.
College, 1 year or more Correlation Summary
| Measurement | Immigrants from Senegal | Filipino |
| Minimum | 26.1% | 35.1% |
| Maximum | 74.6% | 100.0% |
| Range | 48.5% | 64.9% |
| Mean | 55.9% | 75.4% |
| Median | 56.6% | 75.7% |
| Interquartile 25% (IQ1) | 51.3% | 69.8% |
| Interquartile 75% (IQ3) | 61.1% | 83.8% |
| Interquartile Range (IQR) | 9.8% | 13.9% |
| Standard Deviation (Sample) | 9.4% | 11.7% |
| Standard Deviation (Population) | 9.3% | 11.7% |
Similar Demographics by College, 1 year or more
Demographics Similar to Immigrants from Senegal by College, 1 year or more
In terms of college, 1 year or more, the demographic groups most similar to Immigrants from Senegal are French Canadian (57.8%, a difference of 0.0%), Immigrants from Colombia (57.8%, a difference of 0.030%), Tongan (57.8%, a difference of 0.040%), Immigrants from Peru (57.7%, a difference of 0.17%), and Immigrants from Nigeria (57.9%, a difference of 0.18%).
| Demographics | Rating | Rank | College, 1 year or more |
| Immigrants | Zaire | 18.7 /100 | #205 | Poor 58.3% |
| Immigrants | Vietnam | 18.2 /100 | #206 | Poor 58.2% |
| Senegalese | 16.9 /100 | #207 | Poor 58.2% |
| Immigrants | Uruguay | 15.2 /100 | #208 | Poor 58.1% |
| Immigrants | Middle Africa | 14.0 /100 | #209 | Poor 58.0% |
| Tsimshian | 13.5 /100 | #210 | Poor 57.9% |
| Immigrants | Nigeria | 13.3 /100 | #211 | Poor 57.9% |
| Immigrants | Senegal | 11.8 /100 | #212 | Poor 57.8% |
| French Canadians | 11.8 /100 | #213 | Poor 57.8% |
| Immigrants | Colombia | 11.6 /100 | #214 | Poor 57.8% |
| Tongans | 11.6 /100 | #215 | Poor 57.8% |
| Immigrants | Peru | 10.6 /100 | #216 | Poor 57.7% |
| Immigrants | Panama | 9.1 /100 | #217 | Tragic 57.6% |
| Native Hawaiians | 9.0 /100 | #218 | Tragic 57.6% |
| Whites/Caucasians | 8.7 /100 | #219 | Tragic 57.6% |
Demographics Similar to Filipinos by College, 1 year or more
In terms of college, 1 year or more, the demographic groups most similar to Filipinos are Immigrants from Singapore (70.1%, a difference of 1.2%), Iranian (70.0%, a difference of 1.4%), Immigrants from Taiwan (69.6%, a difference of 1.9%), Immigrants from India (69.6%, a difference of 1.9%), and Immigrants from Iran (69.5%, a difference of 2.1%).
| Demographics | Rating | Rank | College, 1 year or more |
| Filipinos | 100.0 /100 | #1 | Exceptional 71.0% |
| Immigrants | Singapore | 100.0 /100 | #2 | Exceptional 70.1% |
| Iranians | 100.0 /100 | #3 | Exceptional 70.0% |
| Immigrants | Taiwan | 100.0 /100 | #4 | Exceptional 69.6% |
| Immigrants | India | 100.0 /100 | #5 | Exceptional 69.6% |
| Immigrants | Iran | 100.0 /100 | #6 | Exceptional 69.5% |
| Okinawans | 100.0 /100 | #7 | Exceptional 69.0% |
| Thais | 100.0 /100 | #8 | Exceptional 68.6% |
| Immigrants | Israel | 100.0 /100 | #9 | Exceptional 67.8% |
| Immigrants | Australia | 100.0 /100 | #10 | Exceptional 67.7% |
| Immigrants | South Central Asia | 100.0 /100 | #11 | Exceptional 67.1% |
| Cypriots | 100.0 /100 | #12 | Exceptional 67.0% |
| Immigrants | Sweden | 100.0 /100 | #13 | Exceptional 66.8% |
| Burmese | 100.0 /100 | #14 | Exceptional 66.7% |
| Cambodians | 100.0 /100 | #15 | Exceptional 66.7% |