Immigrants from Scotland vs Immigrants from Latvia Unemployment Among Ages 25 to 29 years
COMPARE
Immigrants from Scotland
Immigrants from Latvia
Unemployment Among Ages 25 to 29 years
Unemployment Among Ages 25 to 29 years Comparison
Immigrants from Scotland
Immigrants from Latvia
6.7%
UNEMPLOYMENT AMONG AGES 25 TO 29 YEARS
39.6/ 100
METRIC RATING
183rd/ 347
METRIC RANK
6.6%
UNEMPLOYMENT AMONG AGES 25 TO 29 YEARS
63.9/ 100
METRIC RATING
155th/ 347
METRIC RANK
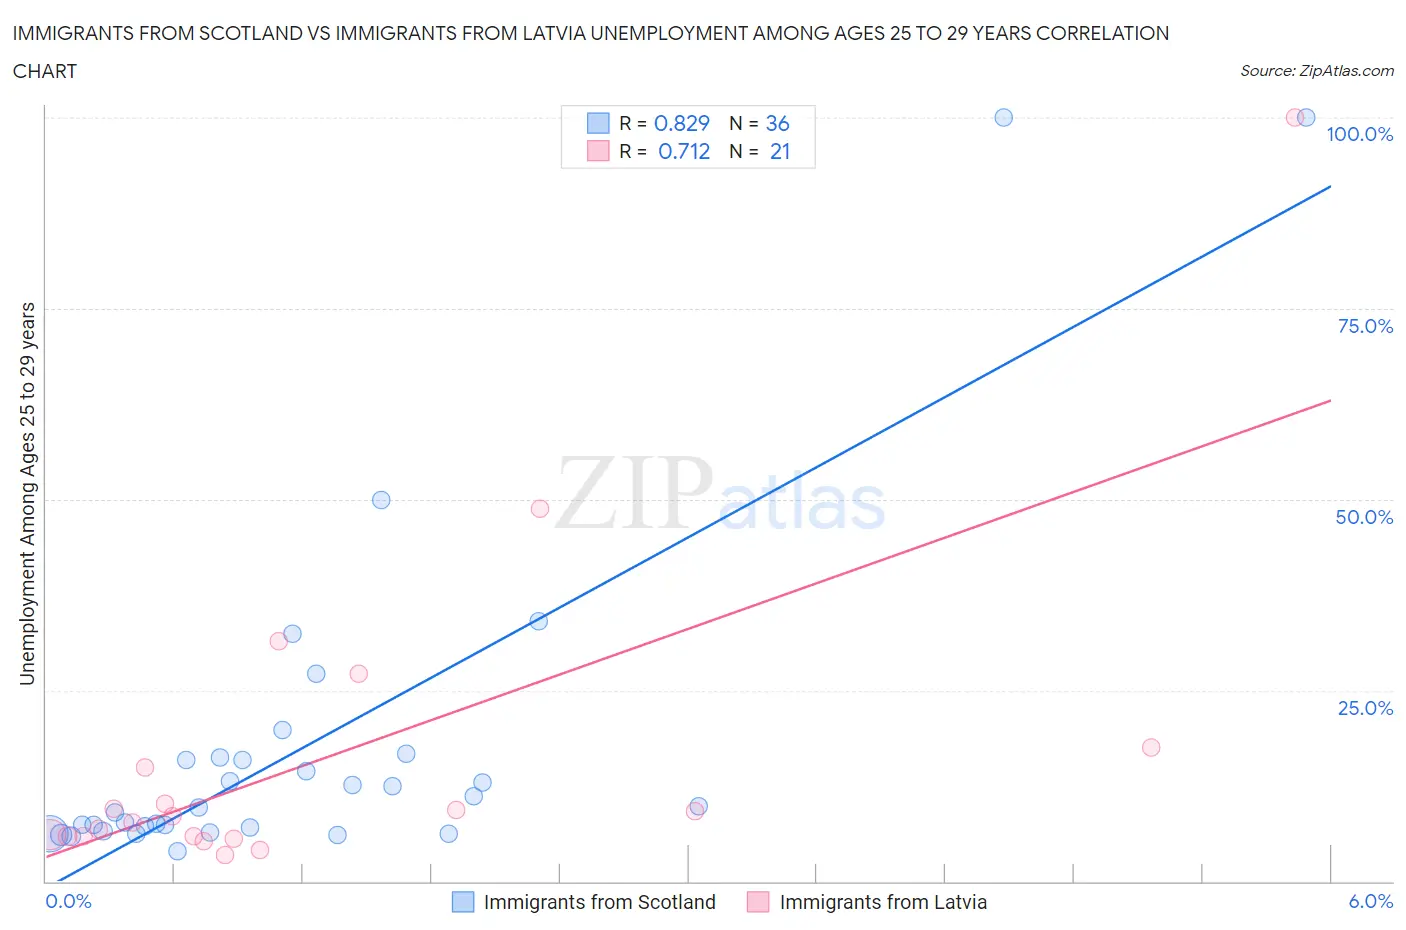
Immigrants from Scotland vs Immigrants from Latvia Unemployment Among Ages 25 to 29 years Correlation Chart
The statistical analysis conducted on geographies consisting of 189,373,461 people shows a very strong positive correlation between the proportion of Immigrants from Scotland and unemployment rate among population between the ages 25 and 29 in the United States with a correlation coefficient (R) of 0.829 and weighted average of 6.7%. Similarly, the statistical analysis conducted on geographies consisting of 111,655,823 people shows a strong positive correlation between the proportion of Immigrants from Latvia and unemployment rate among population between the ages 25 and 29 in the United States with a correlation coefficient (R) of 0.712 and weighted average of 6.6%, a difference of 1.5%.
Unemployment Among Ages 25 to 29 years Correlation Summary
| Measurement | Immigrants from Scotland | Immigrants from Latvia |
| Minimum | 3.9% | 3.4% |
| Maximum | 100.0% | 100.0% |
| Range | 96.1% | 96.6% |
| Mean | 17.7% | 16.3% |
| Median | 9.7% | 8.5% |
| Interquartile 25% (IQ1) | 6.8% | 5.9% |
| Interquartile 75% (IQ3) | 16.0% | 16.2% |
| Interquartile Range (IQR) | 9.3% | 10.3% |
| Standard Deviation (Sample) | 22.4% | 22.1% |
| Standard Deviation (Population) | 22.1% | 21.6% |
Similar Demographics by Unemployment Among Ages 25 to 29 years
Demographics Similar to Immigrants from Scotland by Unemployment Among Ages 25 to 29 years
In terms of unemployment among ages 25 to 29 years, the demographic groups most similar to Immigrants from Scotland are Czechoslovakian (6.7%, a difference of 0.070%), Immigrants from Africa (6.7%, a difference of 0.090%), Immigrants from Western Europe (6.7%, a difference of 0.090%), Immigrants from Costa Rica (6.7%, a difference of 0.090%), and Moroccan (6.7%, a difference of 0.25%).
| Demographics | Rating | Rank | Unemployment Among Ages 25 to 29 years |
| Osage | 48.1 /100 | #176 | Average 6.7% |
| Immigrants | Israel | 47.8 /100 | #177 | Average 6.7% |
| Immigrants | Iraq | 45.1 /100 | #178 | Average 6.7% |
| Costa Ricans | 44.9 /100 | #179 | Average 6.7% |
| Immigrants | Africa | 41.1 /100 | #180 | Average 6.7% |
| Immigrants | Western Europe | 41.1 /100 | #181 | Average 6.7% |
| Czechoslovakians | 40.7 /100 | #182 | Average 6.7% |
| Immigrants | Scotland | 39.6 /100 | #183 | Fair 6.7% |
| Immigrants | Costa Rica | 38.3 /100 | #184 | Fair 6.7% |
| Moroccans | 35.9 /100 | #185 | Fair 6.7% |
| Immigrants | Iran | 34.4 /100 | #186 | Fair 6.7% |
| Immigrants | South America | 33.0 /100 | #187 | Fair 6.7% |
| Irish | 32.8 /100 | #188 | Fair 6.7% |
| Argentineans | 32.1 /100 | #189 | Fair 6.7% |
| Koreans | 29.3 /100 | #190 | Fair 6.7% |
Demographics Similar to Immigrants from Latvia by Unemployment Among Ages 25 to 29 years
In terms of unemployment among ages 25 to 29 years, the demographic groups most similar to Immigrants from Latvia are Colombian (6.6%, a difference of 0.010%), Immigrants from Laos (6.6%, a difference of 0.020%), South African (6.6%, a difference of 0.020%), Immigrants from Italy (6.6%, a difference of 0.030%), and Samoan (6.6%, a difference of 0.050%).
| Demographics | Rating | Rank | Unemployment Among Ages 25 to 29 years |
| Peruvians | 68.1 /100 | #148 | Good 6.6% |
| Malaysians | 67.1 /100 | #149 | Good 6.6% |
| Finns | 66.9 /100 | #150 | Good 6.6% |
| Ukrainians | 65.5 /100 | #151 | Good 6.6% |
| Samoans | 64.6 /100 | #152 | Good 6.6% |
| Immigrants | Italy | 64.4 /100 | #153 | Good 6.6% |
| Colombians | 64.0 /100 | #154 | Good 6.6% |
| Immigrants | Latvia | 63.9 /100 | #155 | Good 6.6% |
| Immigrants | Laos | 63.5 /100 | #156 | Good 6.6% |
| South Africans | 63.5 /100 | #157 | Good 6.6% |
| Immigrants | Russia | 61.5 /100 | #158 | Good 6.6% |
| Welsh | 61.3 /100 | #159 | Good 6.6% |
| Scottish | 60.7 /100 | #160 | Good 6.6% |
| Paraguayans | 60.4 /100 | #161 | Good 6.6% |
| Immigrants | Czechoslovakia | 60.2 /100 | #162 | Good 6.6% |