Immigrants from Saudi Arabia vs Vietnamese 4th Grade
COMPARE
Immigrants from Saudi Arabia
Vietnamese
4th Grade
4th Grade Comparison
Immigrants from Saudi Arabia
Vietnamese
97.8%
4TH GRADE
94.8/ 100
METRIC RATING
119th/ 347
METRIC RANK
96.2%
4TH GRADE
0.0/ 100
METRIC RATING
314th/ 347
METRIC RANK
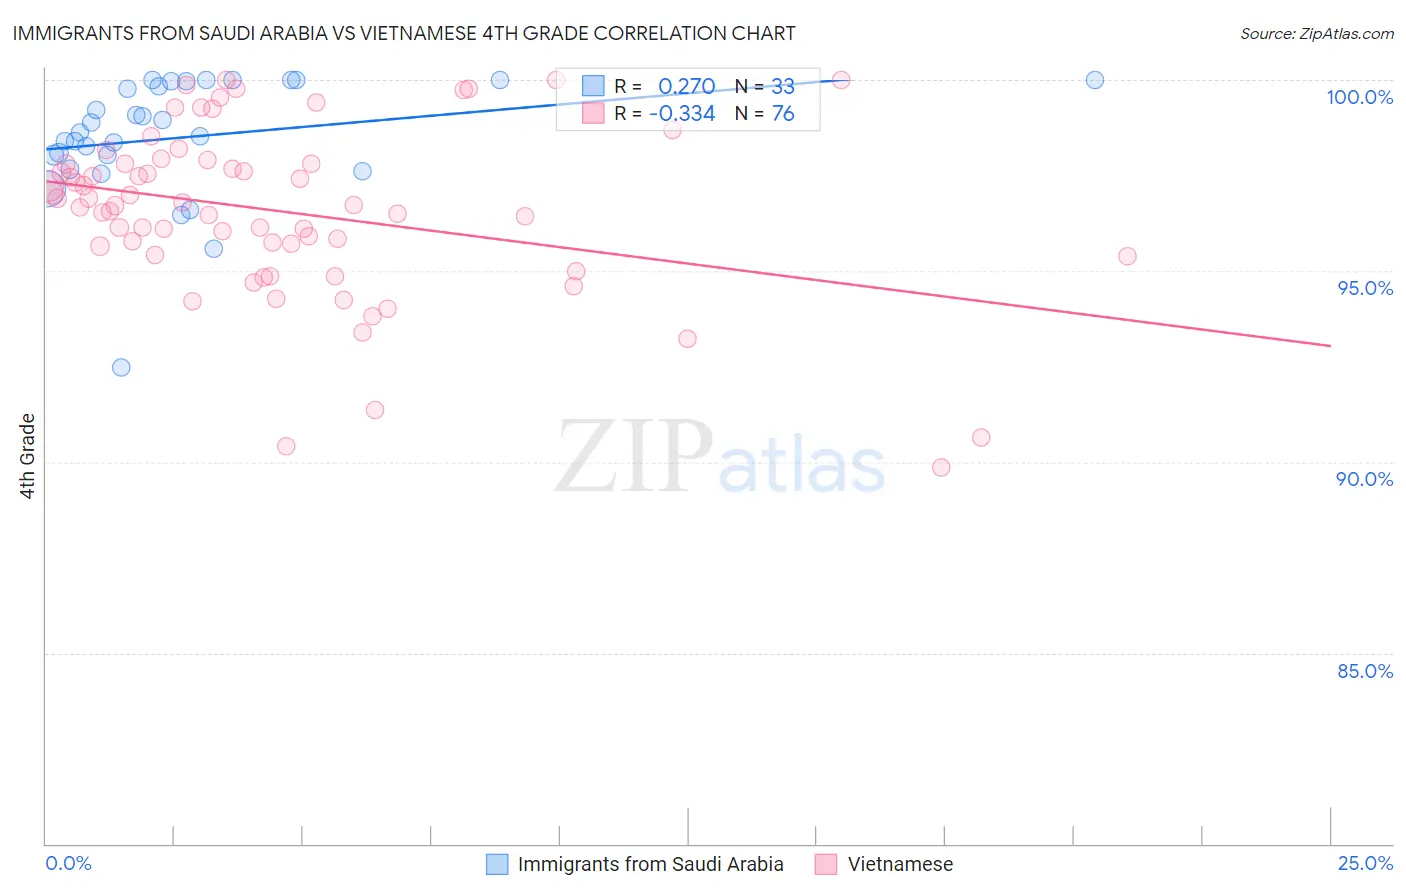
Immigrants from Saudi Arabia vs Vietnamese 4th Grade Correlation Chart
The statistical analysis conducted on geographies consisting of 164,277,573 people shows a weak positive correlation between the proportion of Immigrants from Saudi Arabia and percentage of population with at least 4th grade education in the United States with a correlation coefficient (R) of 0.270 and weighted average of 97.8%. Similarly, the statistical analysis conducted on geographies consisting of 170,726,780 people shows a mild negative correlation between the proportion of Vietnamese and percentage of population with at least 4th grade education in the United States with a correlation coefficient (R) of -0.334 and weighted average of 96.2%, a difference of 1.6%.
4th Grade Correlation Summary
| Measurement | Immigrants from Saudi Arabia | Vietnamese |
| Minimum | 92.5% | 89.8% |
| Maximum | 100.0% | 100.0% |
| Range | 7.5% | 10.2% |
| Mean | 98.5% | 96.6% |
| Median | 98.6% | 96.7% |
| Interquartile 25% (IQ1) | 97.8% | 95.5% |
| Interquartile 75% (IQ3) | 100.0% | 97.8% |
| Interquartile Range (IQR) | 2.1% | 2.3% |
| Standard Deviation (Sample) | 1.6% | 2.2% |
| Standard Deviation (Population) | 1.6% | 2.2% |
Similar Demographics by 4th Grade
Demographics Similar to Immigrants from Saudi Arabia by 4th Grade
In terms of 4th grade, the demographic groups most similar to Immigrants from Saudi Arabia are Syrian (97.8%, a difference of 0.0%), Menominee (97.8%, a difference of 0.0%), Immigrants from France (97.8%, a difference of 0.0%), Iroquois (97.8%, a difference of 0.010%), and Lebanese (97.8%, a difference of 0.010%).
| Demographics | Rating | Rank | 4th Grade |
| Okinawans | 96.0 /100 | #112 | Exceptional 97.8% |
| Basques | 95.8 /100 | #113 | Exceptional 97.8% |
| Iroquois | 95.4 /100 | #114 | Exceptional 97.8% |
| Lebanese | 95.4 /100 | #115 | Exceptional 97.8% |
| Immigrants | Croatia | 95.2 /100 | #116 | Exceptional 97.8% |
| Syrians | 94.9 /100 | #117 | Exceptional 97.8% |
| Menominee | 94.9 /100 | #118 | Exceptional 97.8% |
| Immigrants | Saudi Arabia | 94.8 /100 | #119 | Exceptional 97.8% |
| Immigrants | France | 94.8 /100 | #120 | Exceptional 97.8% |
| Immigrants | Norway | 94.2 /100 | #121 | Exceptional 97.8% |
| Immigrants | Japan | 94.1 /100 | #122 | Exceptional 97.8% |
| Immigrants | Zimbabwe | 93.9 /100 | #123 | Exceptional 97.8% |
| Spanish | 93.7 /100 | #124 | Exceptional 97.8% |
| Immigrants | Serbia | 92.6 /100 | #125 | Exceptional 97.8% |
| Immigrants | Europe | 92.5 /100 | #126 | Exceptional 97.8% |
Demographics Similar to Vietnamese by 4th Grade
In terms of 4th grade, the demographic groups most similar to Vietnamese are Indonesian (96.2%, a difference of 0.0%), Nicaraguan (96.2%, a difference of 0.010%), Immigrants from Ecuador (96.2%, a difference of 0.010%), Cape Verdean (96.2%, a difference of 0.020%), and Immigrants from Bangladesh (96.2%, a difference of 0.030%).
| Demographics | Rating | Rank | 4th Grade |
| Immigrants | Haiti | 0.0 /100 | #307 | Tragic 96.3% |
| Immigrants | Laos | 0.0 /100 | #308 | Tragic 96.3% |
| Immigrants | Guyana | 0.0 /100 | #309 | Tragic 96.3% |
| Immigrants | Burma/Myanmar | 0.0 /100 | #310 | Tragic 96.3% |
| Immigrants | Bangladesh | 0.0 /100 | #311 | Tragic 96.2% |
| Cape Verdeans | 0.0 /100 | #312 | Tragic 96.2% |
| Indonesians | 0.0 /100 | #313 | Tragic 96.2% |
| Vietnamese | 0.0 /100 | #314 | Tragic 96.2% |
| Nicaraguans | 0.0 /100 | #315 | Tragic 96.2% |
| Immigrants | Ecuador | 0.0 /100 | #316 | Tragic 96.2% |
| Central American Indians | 0.0 /100 | #317 | Tragic 96.2% |
| Immigrants | Azores | 0.0 /100 | #318 | Tragic 96.1% |
| Belizeans | 0.0 /100 | #319 | Tragic 96.1% |
| Bangladeshis | 0.0 /100 | #320 | Tragic 96.1% |
| Japanese | 0.0 /100 | #321 | Tragic 96.0% |