Immigrants from Taiwan vs Vietnamese 4th Grade
COMPARE
Immigrants from Taiwan
Vietnamese
4th Grade
4th Grade Comparison
Immigrants from Taiwan
Vietnamese
97.5%
4TH GRADE
41.5/ 100
METRIC RATING
181st/ 347
METRIC RANK
96.2%
4TH GRADE
0.0/ 100
METRIC RATING
314th/ 347
METRIC RANK
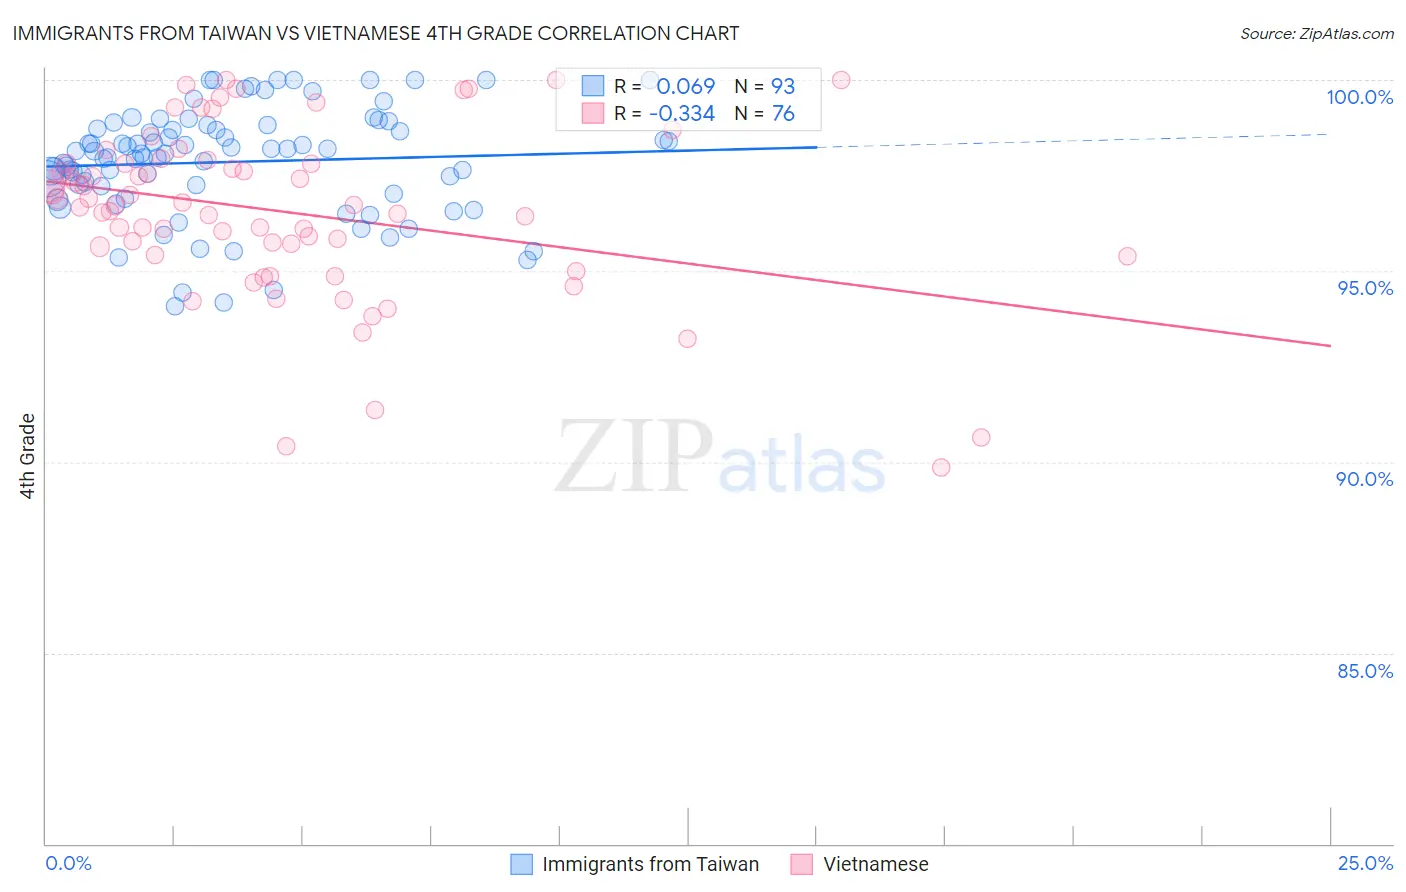
Immigrants from Taiwan vs Vietnamese 4th Grade Correlation Chart
The statistical analysis conducted on geographies consisting of 298,069,082 people shows a slight positive correlation between the proportion of Immigrants from Taiwan and percentage of population with at least 4th grade education in the United States with a correlation coefficient (R) of 0.069 and weighted average of 97.5%. Similarly, the statistical analysis conducted on geographies consisting of 170,726,780 people shows a mild negative correlation between the proportion of Vietnamese and percentage of population with at least 4th grade education in the United States with a correlation coefficient (R) of -0.334 and weighted average of 96.2%, a difference of 1.3%.
4th Grade Correlation Summary
| Measurement | Immigrants from Taiwan | Vietnamese |
| Minimum | 94.1% | 89.8% |
| Maximum | 100.0% | 100.0% |
| Range | 5.9% | 10.2% |
| Mean | 97.9% | 96.6% |
| Median | 98.1% | 96.7% |
| Interquartile 25% (IQ1) | 97.1% | 95.5% |
| Interquartile 75% (IQ3) | 98.8% | 97.8% |
| Interquartile Range (IQR) | 1.7% | 2.3% |
| Standard Deviation (Sample) | 1.4% | 2.2% |
| Standard Deviation (Population) | 1.4% | 2.2% |
Similar Demographics by 4th Grade
Demographics Similar to Immigrants from Taiwan by 4th Grade
In terms of 4th grade, the demographic groups most similar to Immigrants from Taiwan are Immigrants from Venezuela (97.5%, a difference of 0.0%), Comanche (97.5%, a difference of 0.010%), Immigrants from Kazakhstan (97.5%, a difference of 0.010%), Spanish American (97.5%, a difference of 0.010%), and Argentinean (97.5%, a difference of 0.010%).
| Demographics | Rating | Rank | 4th Grade |
| Egyptians | 50.0 /100 | #174 | Average 97.5% |
| Immigrants | Micronesia | 49.6 /100 | #175 | Average 97.5% |
| Arabs | 48.7 /100 | #176 | Average 97.5% |
| Immigrants | Brazil | 46.1 /100 | #177 | Average 97.5% |
| Comanche | 45.3 /100 | #178 | Average 97.5% |
| Immigrants | Kazakhstan | 43.6 /100 | #179 | Average 97.5% |
| Immigrants | Venezuela | 42.7 /100 | #180 | Average 97.5% |
| Immigrants | Taiwan | 41.5 /100 | #181 | Average 97.5% |
| Spanish Americans | 39.3 /100 | #182 | Fair 97.5% |
| Argentineans | 39.0 /100 | #183 | Fair 97.5% |
| Pakistanis | 36.2 /100 | #184 | Fair 97.5% |
| Immigrants | Kenya | 35.8 /100 | #185 | Fair 97.5% |
| Dutch West Indians | 35.8 /100 | #186 | Fair 97.5% |
| Mongolians | 34.7 /100 | #187 | Fair 97.5% |
| Immigrants | Argentina | 34.6 /100 | #188 | Fair 97.5% |
Demographics Similar to Vietnamese by 4th Grade
In terms of 4th grade, the demographic groups most similar to Vietnamese are Indonesian (96.2%, a difference of 0.0%), Nicaraguan (96.2%, a difference of 0.010%), Immigrants from Ecuador (96.2%, a difference of 0.010%), Cape Verdean (96.2%, a difference of 0.020%), and Immigrants from Bangladesh (96.2%, a difference of 0.030%).
| Demographics | Rating | Rank | 4th Grade |
| Immigrants | Haiti | 0.0 /100 | #307 | Tragic 96.3% |
| Immigrants | Laos | 0.0 /100 | #308 | Tragic 96.3% |
| Immigrants | Guyana | 0.0 /100 | #309 | Tragic 96.3% |
| Immigrants | Burma/Myanmar | 0.0 /100 | #310 | Tragic 96.3% |
| Immigrants | Bangladesh | 0.0 /100 | #311 | Tragic 96.2% |
| Cape Verdeans | 0.0 /100 | #312 | Tragic 96.2% |
| Indonesians | 0.0 /100 | #313 | Tragic 96.2% |
| Vietnamese | 0.0 /100 | #314 | Tragic 96.2% |
| Nicaraguans | 0.0 /100 | #315 | Tragic 96.2% |
| Immigrants | Ecuador | 0.0 /100 | #316 | Tragic 96.2% |
| Central American Indians | 0.0 /100 | #317 | Tragic 96.2% |
| Immigrants | Azores | 0.0 /100 | #318 | Tragic 96.1% |
| Belizeans | 0.0 /100 | #319 | Tragic 96.1% |
| Bangladeshis | 0.0 /100 | #320 | Tragic 96.1% |
| Japanese | 0.0 /100 | #321 | Tragic 96.0% |