Immigrants from Dominican Republic vs Vietnamese 4th Grade
COMPARE
Immigrants from Dominican Republic
Vietnamese
4th Grade
4th Grade Comparison
Immigrants from Dominican Republic
Vietnamese
95.7%
4TH GRADE
0.0/ 100
METRIC RATING
333rd/ 347
METRIC RANK
96.2%
4TH GRADE
0.0/ 100
METRIC RATING
314th/ 347
METRIC RANK
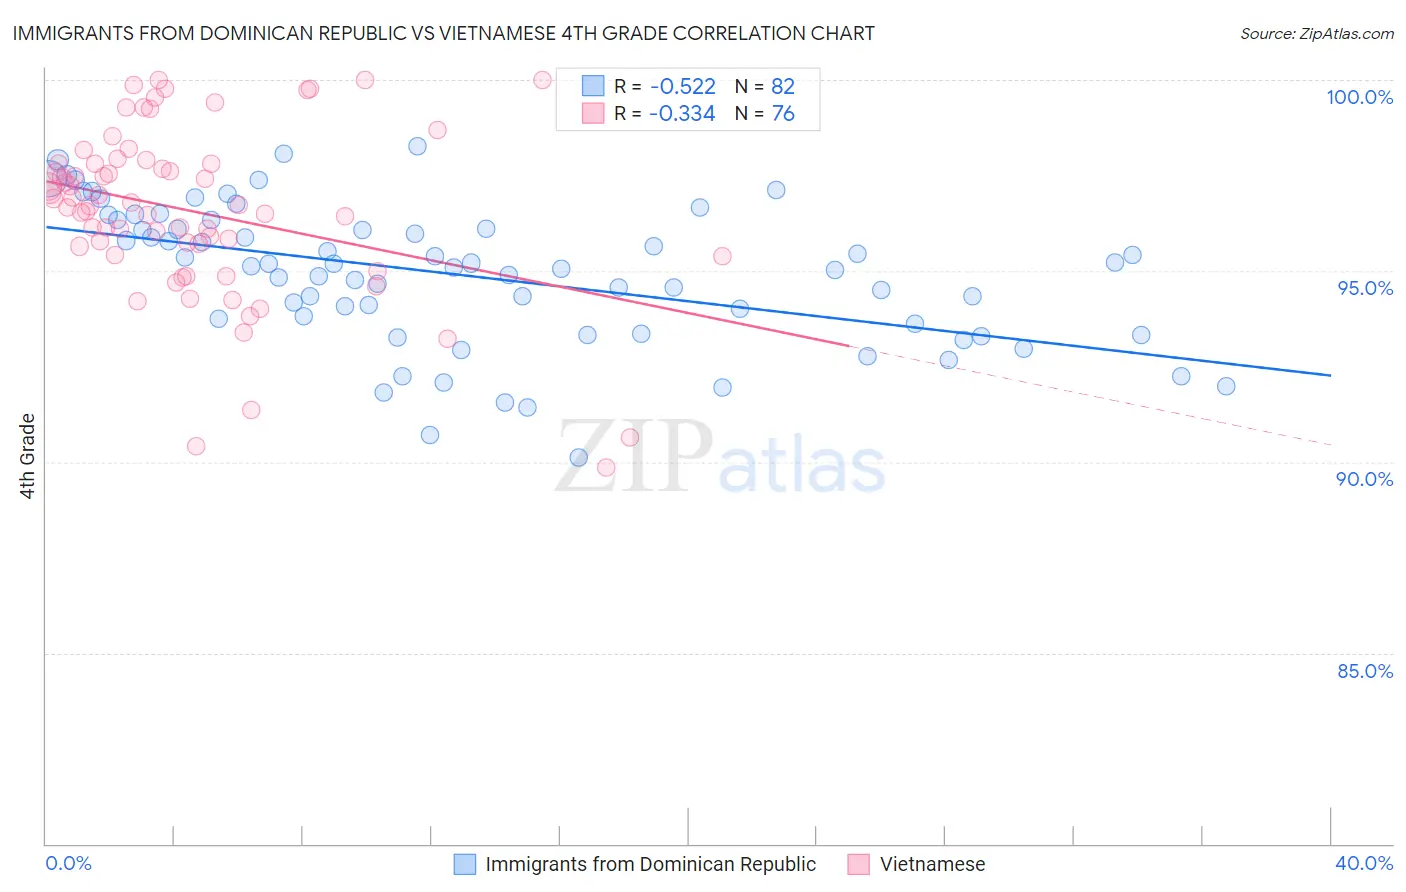
Immigrants from Dominican Republic vs Vietnamese 4th Grade Correlation Chart
The statistical analysis conducted on geographies consisting of 275,142,551 people shows a substantial negative correlation between the proportion of Immigrants from Dominican Republic and percentage of population with at least 4th grade education in the United States with a correlation coefficient (R) of -0.522 and weighted average of 95.7%. Similarly, the statistical analysis conducted on geographies consisting of 170,726,780 people shows a mild negative correlation between the proportion of Vietnamese and percentage of population with at least 4th grade education in the United States with a correlation coefficient (R) of -0.334 and weighted average of 96.2%, a difference of 0.51%.
4th Grade Correlation Summary
| Measurement | Immigrants from Dominican Republic | Vietnamese |
| Minimum | 90.1% | 89.8% |
| Maximum | 98.3% | 100.0% |
| Range | 8.1% | 10.2% |
| Mean | 94.9% | 96.6% |
| Median | 95.1% | 96.7% |
| Interquartile 25% (IQ1) | 93.6% | 95.5% |
| Interquartile 75% (IQ3) | 96.1% | 97.8% |
| Interquartile Range (IQR) | 2.5% | 2.3% |
| Standard Deviation (Sample) | 1.8% | 2.2% |
| Standard Deviation (Population) | 1.8% | 2.2% |
Demographics Similar to Immigrants from Dominican Republic and Vietnamese by 4th Grade
In terms of 4th grade, the demographic groups most similar to Immigrants from Dominican Republic are Immigrants from Honduras (95.8%, a difference of 0.050%), Immigrants from Armenia (95.8%, a difference of 0.060%), Immigrants from Cambodia (95.8%, a difference of 0.11%), Immigrants from Fiji (95.8%, a difference of 0.11%), and Mexican American Indian (95.8%, a difference of 0.12%). Similarly, the demographic groups most similar to Vietnamese are Indonesian (96.2%, a difference of 0.0%), Nicaraguan (96.2%, a difference of 0.010%), Immigrants from Ecuador (96.2%, a difference of 0.010%), Central American Indian (96.2%, a difference of 0.050%), and Immigrants from the Azores (96.1%, a difference of 0.090%).
| Demographics | Rating | Rank | 4th Grade |
| Indonesians | 0.0 /100 | #313 | Tragic 96.2% |
| Vietnamese | 0.0 /100 | #314 | Tragic 96.2% |
| Nicaraguans | 0.0 /100 | #315 | Tragic 96.2% |
| Immigrants | Ecuador | 0.0 /100 | #316 | Tragic 96.2% |
| Central American Indians | 0.0 /100 | #317 | Tragic 96.2% |
| Immigrants | Azores | 0.0 /100 | #318 | Tragic 96.1% |
| Belizeans | 0.0 /100 | #319 | Tragic 96.1% |
| Bangladeshis | 0.0 /100 | #320 | Tragic 96.1% |
| Japanese | 0.0 /100 | #321 | Tragic 96.0% |
| Immigrants | Vietnam | 0.0 /100 | #322 | Tragic 96.0% |
| Immigrants | Nicaragua | 0.0 /100 | #323 | Tragic 96.0% |
| Immigrants | Belize | 0.0 /100 | #324 | Tragic 96.0% |
| Dominicans | 0.0 /100 | #325 | Tragic 96.0% |
| Hispanics or Latinos | 0.0 /100 | #326 | Tragic 96.0% |
| Hondurans | 0.0 /100 | #327 | Tragic 96.0% |
| Mexican American Indians | 0.0 /100 | #328 | Tragic 95.8% |
| Immigrants | Cambodia | 0.0 /100 | #329 | Tragic 95.8% |
| Immigrants | Fiji | 0.0 /100 | #330 | Tragic 95.8% |
| Immigrants | Armenia | 0.0 /100 | #331 | Tragic 95.8% |
| Immigrants | Honduras | 0.0 /100 | #332 | Tragic 95.8% |
| Immigrants | Dominican Republic | 0.0 /100 | #333 | Tragic 95.7% |