Immigrants from Saudi Arabia vs Slovene 4th Grade
COMPARE
Immigrants from Saudi Arabia
Slovene
4th Grade
4th Grade Comparison
Immigrants from Saudi Arabia
Slovenes
97.8%
4TH GRADE
94.8/ 100
METRIC RATING
119th/ 347
METRIC RANK
98.4%
4TH GRADE
100.0/ 100
METRIC RATING
9th/ 347
METRIC RANK
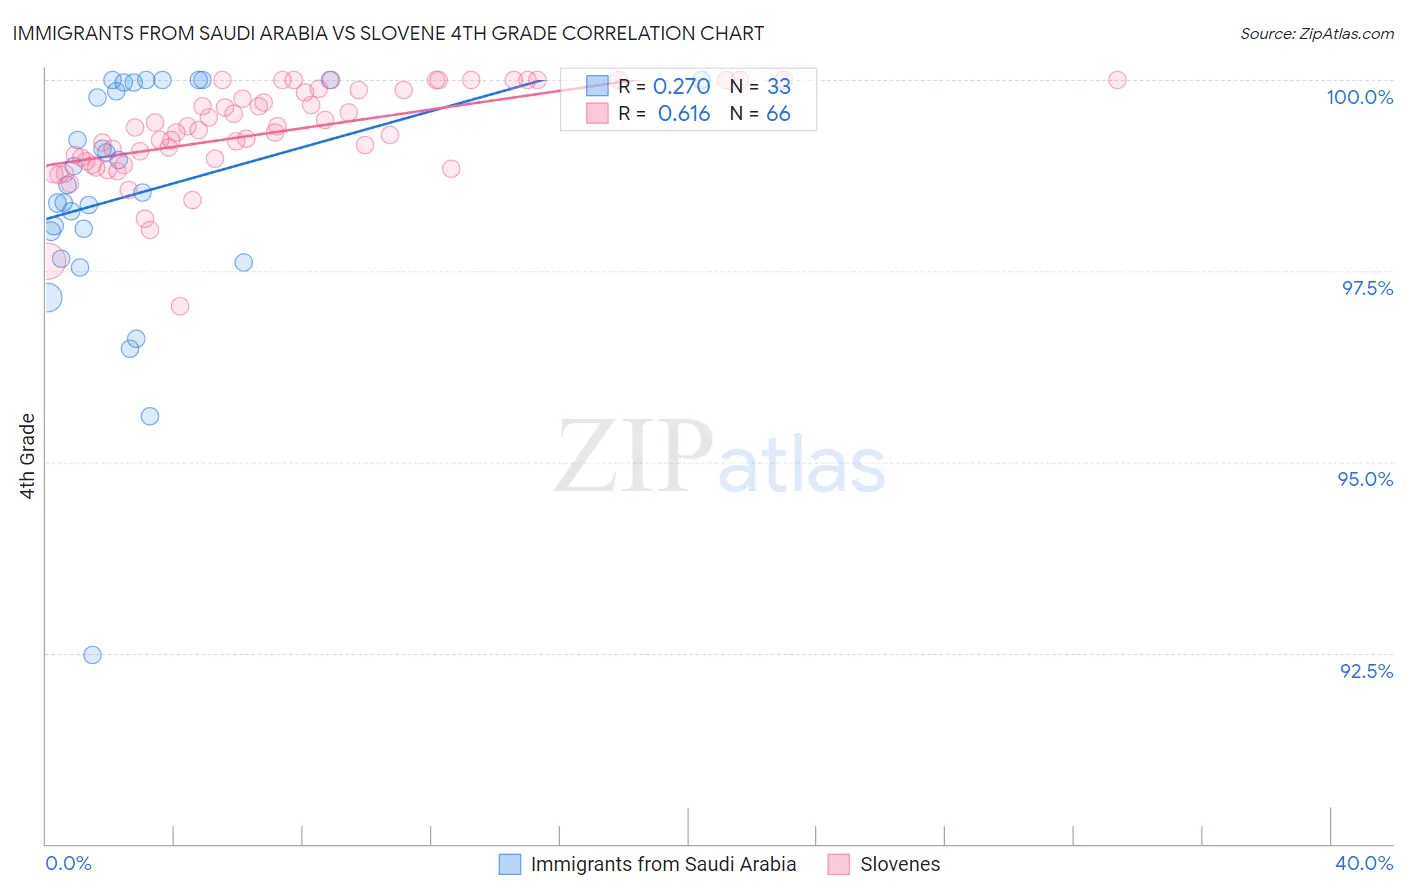
Immigrants from Saudi Arabia vs Slovene 4th Grade Correlation Chart
The statistical analysis conducted on geographies consisting of 164,277,573 people shows a weak positive correlation between the proportion of Immigrants from Saudi Arabia and percentage of population with at least 4th grade education in the United States with a correlation coefficient (R) of 0.270 and weighted average of 97.8%. Similarly, the statistical analysis conducted on geographies consisting of 261,353,374 people shows a significant positive correlation between the proportion of Slovenes and percentage of population with at least 4th grade education in the United States with a correlation coefficient (R) of 0.616 and weighted average of 98.4%, a difference of 0.67%.
4th Grade Correlation Summary
| Measurement | Immigrants from Saudi Arabia | Slovene |
| Minimum | 92.5% | 97.0% |
| Maximum | 100.0% | 100.0% |
| Range | 7.5% | 3.0% |
| Mean | 98.5% | 99.3% |
| Median | 98.6% | 99.4% |
| Interquartile 25% (IQ1) | 97.8% | 98.9% |
| Interquartile 75% (IQ3) | 100.0% | 99.9% |
| Interquartile Range (IQR) | 2.1% | 0.94% |
| Standard Deviation (Sample) | 1.6% | 0.62% |
| Standard Deviation (Population) | 1.6% | 0.62% |
Similar Demographics by 4th Grade
Demographics Similar to Immigrants from Saudi Arabia by 4th Grade
In terms of 4th grade, the demographic groups most similar to Immigrants from Saudi Arabia are Syrian (97.8%, a difference of 0.0%), Menominee (97.8%, a difference of 0.0%), Immigrants from France (97.8%, a difference of 0.0%), Iroquois (97.8%, a difference of 0.010%), and Lebanese (97.8%, a difference of 0.010%).
| Demographics | Rating | Rank | 4th Grade |
| Okinawans | 96.0 /100 | #112 | Exceptional 97.8% |
| Basques | 95.8 /100 | #113 | Exceptional 97.8% |
| Iroquois | 95.4 /100 | #114 | Exceptional 97.8% |
| Lebanese | 95.4 /100 | #115 | Exceptional 97.8% |
| Immigrants | Croatia | 95.2 /100 | #116 | Exceptional 97.8% |
| Syrians | 94.9 /100 | #117 | Exceptional 97.8% |
| Menominee | 94.9 /100 | #118 | Exceptional 97.8% |
| Immigrants | Saudi Arabia | 94.8 /100 | #119 | Exceptional 97.8% |
| Immigrants | France | 94.8 /100 | #120 | Exceptional 97.8% |
| Immigrants | Norway | 94.2 /100 | #121 | Exceptional 97.8% |
| Immigrants | Japan | 94.1 /100 | #122 | Exceptional 97.8% |
| Immigrants | Zimbabwe | 93.9 /100 | #123 | Exceptional 97.8% |
| Spanish | 93.7 /100 | #124 | Exceptional 97.8% |
| Immigrants | Serbia | 92.6 /100 | #125 | Exceptional 97.8% |
| Immigrants | Europe | 92.5 /100 | #126 | Exceptional 97.8% |
Demographics Similar to Slovenes by 4th Grade
In terms of 4th grade, the demographic groups most similar to Slovenes are Alaskan Athabascan (98.4%, a difference of 0.020%), English (98.4%, a difference of 0.030%), Tlingit-Haida (98.4%, a difference of 0.030%), Swedish (98.4%, a difference of 0.030%), and Slovak (98.5%, a difference of 0.040%).
| Demographics | Rating | Rank | 4th Grade |
| Welsh | 100.0 /100 | #2 | Exceptional 98.7% |
| Tsimshian | 100.0 /100 | #3 | Exceptional 98.6% |
| Inupiat | 100.0 /100 | #4 | Exceptional 98.6% |
| Yup'ik | 100.0 /100 | #5 | Exceptional 98.5% |
| Norwegians | 100.0 /100 | #6 | Exceptional 98.5% |
| Slovaks | 100.0 /100 | #7 | Exceptional 98.5% |
| Germans | 100.0 /100 | #8 | Exceptional 98.5% |
| Slovenes | 100.0 /100 | #9 | Exceptional 98.4% |
| Alaskan Athabascans | 100.0 /100 | #10 | Exceptional 98.4% |
| English | 100.0 /100 | #11 | Exceptional 98.4% |
| Tlingit-Haida | 100.0 /100 | #12 | Exceptional 98.4% |
| Swedes | 100.0 /100 | #13 | Exceptional 98.4% |
| Carpatho Rusyns | 100.0 /100 | #14 | Exceptional 98.4% |
| Dutch | 100.0 /100 | #15 | Exceptional 98.4% |
| Scottish | 100.0 /100 | #16 | Exceptional 98.4% |