Immigrants from Saudi Arabia vs Nigerian 4th Grade
COMPARE
Immigrants from Saudi Arabia
Nigerian
4th Grade
4th Grade Comparison
Immigrants from Saudi Arabia
Nigerians
97.8%
4TH GRADE
94.8/ 100
METRIC RATING
119th/ 347
METRIC RANK
97.1%
4TH GRADE
1.8/ 100
METRIC RATING
239th/ 347
METRIC RANK
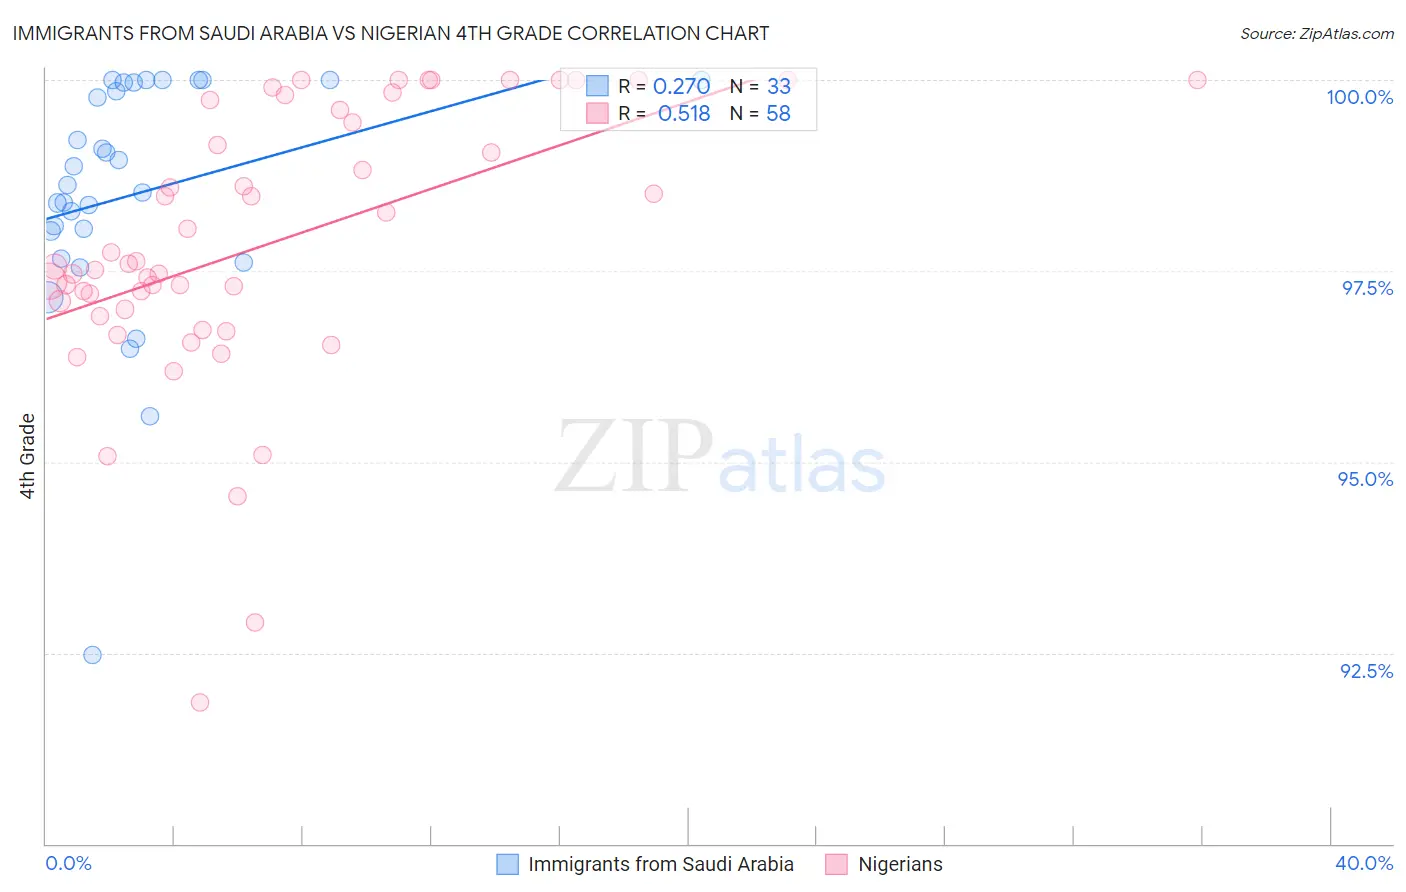
Immigrants from Saudi Arabia vs Nigerian 4th Grade Correlation Chart
The statistical analysis conducted on geographies consisting of 164,277,573 people shows a weak positive correlation between the proportion of Immigrants from Saudi Arabia and percentage of population with at least 4th grade education in the United States with a correlation coefficient (R) of 0.270 and weighted average of 97.8%. Similarly, the statistical analysis conducted on geographies consisting of 332,724,627 people shows a substantial positive correlation between the proportion of Nigerians and percentage of population with at least 4th grade education in the United States with a correlation coefficient (R) of 0.518 and weighted average of 97.1%, a difference of 0.66%.
4th Grade Correlation Summary
| Measurement | Immigrants from Saudi Arabia | Nigerian |
| Minimum | 92.5% | 91.9% |
| Maximum | 100.0% | 100.0% |
| Range | 7.5% | 8.1% |
| Mean | 98.5% | 97.9% |
| Median | 98.6% | 97.6% |
| Interquartile 25% (IQ1) | 97.8% | 97.0% |
| Interquartile 75% (IQ3) | 100.0% | 99.6% |
| Interquartile Range (IQR) | 2.1% | 2.6% |
| Standard Deviation (Sample) | 1.6% | 1.8% |
| Standard Deviation (Population) | 1.6% | 1.8% |
Similar Demographics by 4th Grade
Demographics Similar to Immigrants from Saudi Arabia by 4th Grade
In terms of 4th grade, the demographic groups most similar to Immigrants from Saudi Arabia are Syrian (97.8%, a difference of 0.0%), Menominee (97.8%, a difference of 0.0%), Immigrants from France (97.8%, a difference of 0.0%), Iroquois (97.8%, a difference of 0.010%), and Lebanese (97.8%, a difference of 0.010%).
| Demographics | Rating | Rank | 4th Grade |
| Okinawans | 96.0 /100 | #112 | Exceptional 97.8% |
| Basques | 95.8 /100 | #113 | Exceptional 97.8% |
| Iroquois | 95.4 /100 | #114 | Exceptional 97.8% |
| Lebanese | 95.4 /100 | #115 | Exceptional 97.8% |
| Immigrants | Croatia | 95.2 /100 | #116 | Exceptional 97.8% |
| Syrians | 94.9 /100 | #117 | Exceptional 97.8% |
| Menominee | 94.9 /100 | #118 | Exceptional 97.8% |
| Immigrants | Saudi Arabia | 94.8 /100 | #119 | Exceptional 97.8% |
| Immigrants | France | 94.8 /100 | #120 | Exceptional 97.8% |
| Immigrants | Norway | 94.2 /100 | #121 | Exceptional 97.8% |
| Immigrants | Japan | 94.1 /100 | #122 | Exceptional 97.8% |
| Immigrants | Zimbabwe | 93.9 /100 | #123 | Exceptional 97.8% |
| Spanish | 93.7 /100 | #124 | Exceptional 97.8% |
| Immigrants | Serbia | 92.6 /100 | #125 | Exceptional 97.8% |
| Immigrants | Europe | 92.5 /100 | #126 | Exceptional 97.8% |
Demographics Similar to Nigerians by 4th Grade
In terms of 4th grade, the demographic groups most similar to Nigerians are Immigrants from Costa Rica (97.2%, a difference of 0.010%), Indian (Asian) (97.2%, a difference of 0.010%), Colombian (97.1%, a difference of 0.010%), Immigrants from Indonesia (97.1%, a difference of 0.010%), and Asian (97.1%, a difference of 0.020%).
| Demographics | Rating | Rank | 4th Grade |
| Immigrants | Western Asia | 3.4 /100 | #232 | Tragic 97.2% |
| Senegalese | 3.1 /100 | #233 | Tragic 97.2% |
| Assyrians/Chaldeans/Syriacs | 3.0 /100 | #234 | Tragic 97.2% |
| Yuman | 2.9 /100 | #235 | Tragic 97.2% |
| Immigrants | Eastern Asia | 2.7 /100 | #236 | Tragic 97.2% |
| Immigrants | Costa Rica | 2.0 /100 | #237 | Tragic 97.2% |
| Indians (Asian) | 1.9 /100 | #238 | Tragic 97.2% |
| Nigerians | 1.8 /100 | #239 | Tragic 97.1% |
| Colombians | 1.6 /100 | #240 | Tragic 97.1% |
| Immigrants | Indonesia | 1.5 /100 | #241 | Tragic 97.1% |
| Asians | 1.4 /100 | #242 | Tragic 97.1% |
| U.S. Virgin Islanders | 1.4 /100 | #243 | Tragic 97.1% |
| Koreans | 1.3 /100 | #244 | Tragic 97.1% |
| Immigrants | Eastern Africa | 1.2 /100 | #245 | Tragic 97.1% |
| Immigrants | Uruguay | 1.2 /100 | #246 | Tragic 97.1% |