Immigrants from Romania vs Albanian 12th Grade, No Diploma
COMPARE
Immigrants from Romania
Albanian
12th Grade, No Diploma
12th Grade, No Diploma Comparison
Immigrants from Romania
Albanians
92.3%
12TH GRADE, NO DIPLOMA
98.5/ 100
METRIC RATING
92nd/ 347
METRIC RANK
91.8%
12TH GRADE, NO DIPLOMA
89.3/ 100
METRIC RATING
131st/ 347
METRIC RANK
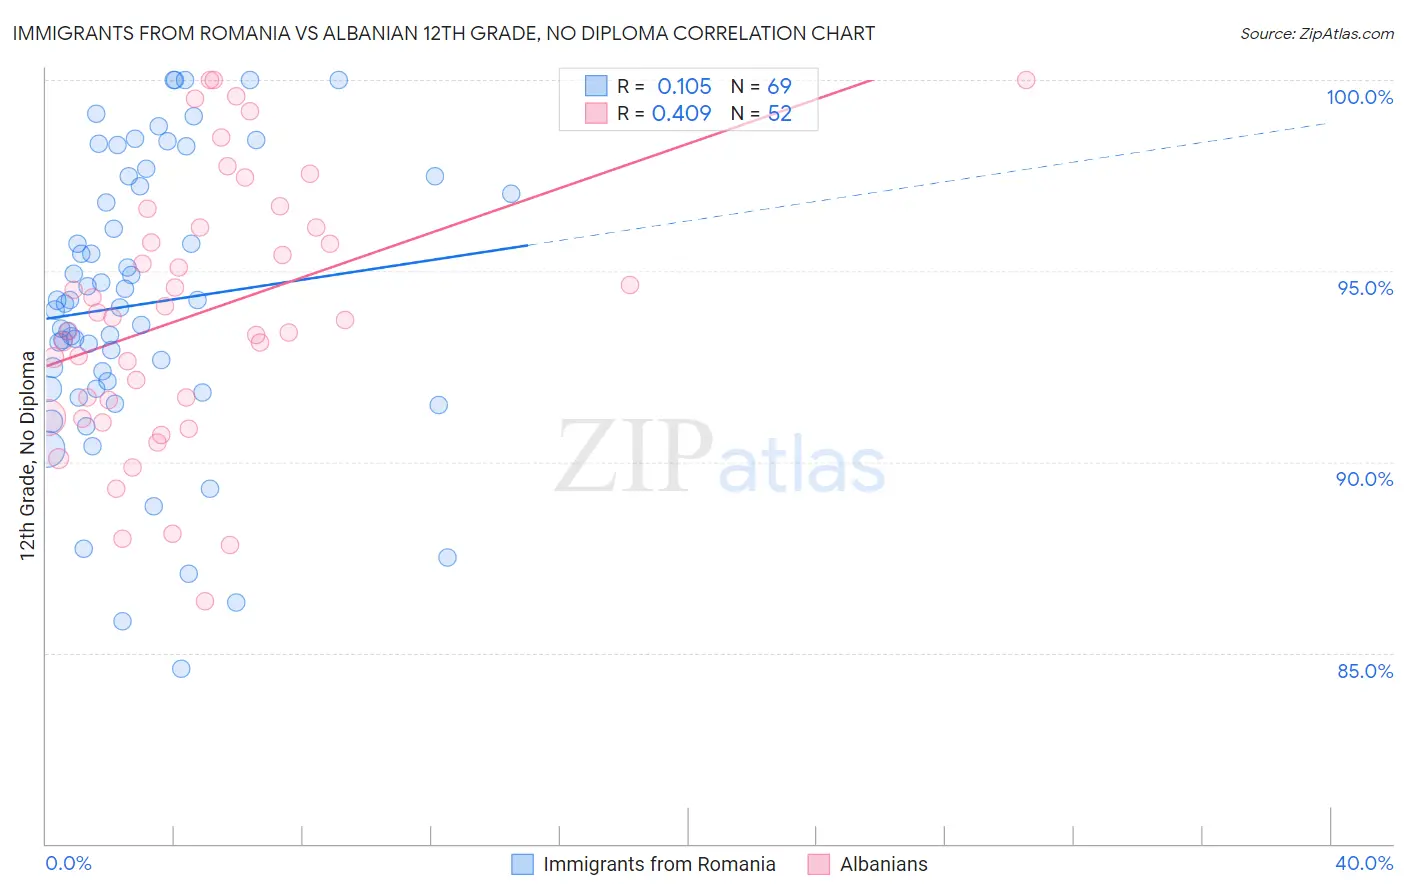
Immigrants from Romania vs Albanian 12th Grade, No Diploma Correlation Chart
The statistical analysis conducted on geographies consisting of 257,013,351 people shows a poor positive correlation between the proportion of Immigrants from Romania and percentage of population with at least 12th grade (no diploma) education in the United States with a correlation coefficient (R) of 0.105 and weighted average of 92.3%. Similarly, the statistical analysis conducted on geographies consisting of 193,265,850 people shows a moderate positive correlation between the proportion of Albanians and percentage of population with at least 12th grade (no diploma) education in the United States with a correlation coefficient (R) of 0.409 and weighted average of 91.8%, a difference of 0.64%.
12th Grade, No Diploma Correlation Summary
| Measurement | Immigrants from Romania | Albanian |
| Minimum | 84.6% | 86.4% |
| Maximum | 100.0% | 100.0% |
| Range | 15.4% | 13.6% |
| Mean | 94.1% | 93.9% |
| Median | 94.1% | 93.8% |
| Interquartile 25% (IQ1) | 91.9% | 91.4% |
| Interquartile 75% (IQ3) | 97.3% | 96.1% |
| Interquartile Range (IQR) | 5.4% | 4.8% |
| Standard Deviation (Sample) | 3.7% | 3.4% |
| Standard Deviation (Population) | 3.7% | 3.4% |
Similar Demographics by 12th Grade, No Diploma
Demographics Similar to Immigrants from Romania by 12th Grade, No Diploma
In terms of 12th grade, no diploma, the demographic groups most similar to Immigrants from Romania are Immigrants from Western Europe (92.3%, a difference of 0.0%), South African (92.4%, a difference of 0.010%), Immigrants from Europe (92.3%, a difference of 0.010%), Immigrants from Serbia (92.4%, a difference of 0.020%), and Immigrants from North Macedonia (92.3%, a difference of 0.020%).
| Demographics | Rating | Rank | 12th Grade, No Diploma |
| Immigrants | Saudi Arabia | 99.0 /100 | #85 | Exceptional 92.5% |
| Immigrants | Turkey | 98.9 /100 | #86 | Exceptional 92.4% |
| Immigrants | France | 98.8 /100 | #87 | Exceptional 92.4% |
| Scotch-Irish | 98.8 /100 | #88 | Exceptional 92.4% |
| Canadians | 98.7 /100 | #89 | Exceptional 92.4% |
| Immigrants | Serbia | 98.6 /100 | #90 | Exceptional 92.4% |
| South Africans | 98.6 /100 | #91 | Exceptional 92.4% |
| Immigrants | Romania | 98.5 /100 | #92 | Exceptional 92.3% |
| Immigrants | Western Europe | 98.5 /100 | #93 | Exceptional 92.3% |
| Immigrants | Europe | 98.5 /100 | #94 | Exceptional 92.3% |
| Immigrants | North Macedonia | 98.5 /100 | #95 | Exceptional 92.3% |
| Icelanders | 98.5 /100 | #96 | Exceptional 92.3% |
| Celtics | 98.4 /100 | #97 | Exceptional 92.3% |
| Immigrants | Kuwait | 98.4 /100 | #98 | Exceptional 92.3% |
| Immigrants | Korea | 98.3 /100 | #99 | Exceptional 92.3% |
Demographics Similar to Albanians by 12th Grade, No Diploma
In terms of 12th grade, no diploma, the demographic groups most similar to Albanians are Immigrants from Eastern Asia (91.8%, a difference of 0.0%), German Russian (91.8%, a difference of 0.010%), Assyrian/Chaldean/Syriac (91.8%, a difference of 0.010%), Mongolian (91.8%, a difference of 0.020%), and Immigrants from Italy (91.7%, a difference of 0.030%).
| Demographics | Rating | Rank | 12th Grade, No Diploma |
| Immigrants | Ukraine | 91.6 /100 | #124 | Exceptional 91.8% |
| Whites/Caucasians | 91.6 /100 | #125 | Exceptional 91.8% |
| Basques | 91.3 /100 | #126 | Exceptional 91.8% |
| Immigrants | Jordan | 91.0 /100 | #127 | Exceptional 91.8% |
| Mongolians | 89.9 /100 | #128 | Excellent 91.8% |
| German Russians | 89.8 /100 | #129 | Excellent 91.8% |
| Assyrians/Chaldeans/Syriacs | 89.6 /100 | #130 | Excellent 91.8% |
| Albanians | 89.3 /100 | #131 | Excellent 91.8% |
| Immigrants | Eastern Asia | 89.3 /100 | #132 | Excellent 91.8% |
| Immigrants | Italy | 88.3 /100 | #133 | Excellent 91.7% |
| Venezuelans | 88.2 /100 | #134 | Excellent 91.7% |
| Immigrants | Bosnia and Herzegovina | 87.3 /100 | #135 | Excellent 91.7% |
| Chileans | 85.8 /100 | #136 | Excellent 91.7% |
| Alaska Natives | 84.9 /100 | #137 | Excellent 91.6% |
| Arabs | 84.1 /100 | #138 | Excellent 91.6% |