Immigrants from Portugal vs Immigrants from South Central Asia Bachelor's Degree
COMPARE
Immigrants from Portugal
Immigrants from South Central Asia
Bachelor's Degree
Bachelor's Degree Comparison
Immigrants from Portugal
Immigrants from South Central Asia
32.2%
BACHELOR'S DEGREE
0.2/ 100
METRIC RATING
268th/ 347
METRIC RANK
48.3%
BACHELOR'S DEGREE
100.0/ 100
METRIC RATING
13th/ 347
METRIC RANK
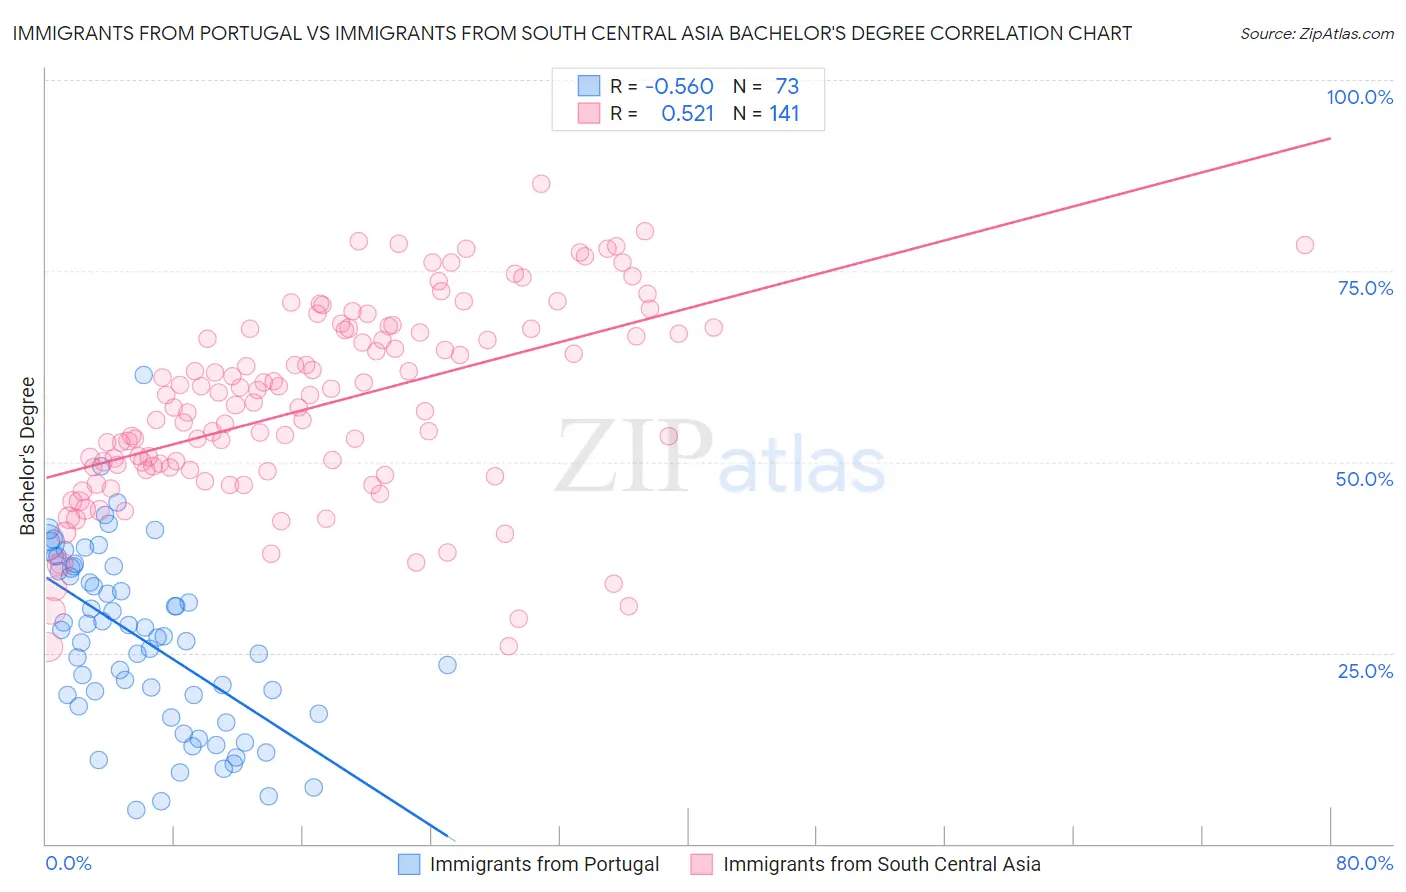
Immigrants from Portugal vs Immigrants from South Central Asia Bachelor's Degree Correlation Chart
The statistical analysis conducted on geographies consisting of 174,788,694 people shows a substantial negative correlation between the proportion of Immigrants from Portugal and percentage of population with at least bachelor's degree education in the United States with a correlation coefficient (R) of -0.560 and weighted average of 32.2%. Similarly, the statistical analysis conducted on geographies consisting of 473,040,508 people shows a substantial positive correlation between the proportion of Immigrants from South Central Asia and percentage of population with at least bachelor's degree education in the United States with a correlation coefficient (R) of 0.521 and weighted average of 48.3%, a difference of 49.9%.
Bachelor's Degree Correlation Summary
| Measurement | Immigrants from Portugal | Immigrants from South Central Asia |
| Minimum | 4.4% | 25.8% |
| Maximum | 61.4% | 86.5% |
| Range | 57.0% | 60.7% |
| Mean | 26.7% | 57.3% |
| Median | 27.2% | 57.4% |
| Interquartile 25% (IQ1) | 17.5% | 49.0% |
| Interquartile 75% (IQ3) | 36.2% | 67.3% |
| Interquartile Range (IQR) | 18.7% | 18.3% |
| Standard Deviation (Sample) | 11.7% | 12.7% |
| Standard Deviation (Population) | 11.6% | 12.7% |
Similar Demographics by Bachelor's Degree
Demographics Similar to Immigrants from Portugal by Bachelor's Degree
In terms of bachelor's degree, the demographic groups most similar to Immigrants from Portugal are Immigrants from Belize (32.1%, a difference of 0.41%), Cuban (32.5%, a difference of 0.76%), Immigrants from Dominica (32.5%, a difference of 0.88%), Bahamian (32.5%, a difference of 0.91%), and Central American Indian (32.5%, a difference of 0.94%).
| Demographics | Rating | Rank | Bachelor's Degree |
| Africans | 0.5 /100 | #261 | Tragic 32.9% |
| Immigrants | Jamaica | 0.5 /100 | #262 | Tragic 32.9% |
| Belizeans | 0.4 /100 | #263 | Tragic 32.8% |
| Central American Indians | 0.3 /100 | #264 | Tragic 32.5% |
| Bahamians | 0.3 /100 | #265 | Tragic 32.5% |
| Immigrants | Dominica | 0.3 /100 | #266 | Tragic 32.5% |
| Cubans | 0.3 /100 | #267 | Tragic 32.5% |
| Immigrants | Portugal | 0.2 /100 | #268 | Tragic 32.2% |
| Immigrants | Belize | 0.2 /100 | #269 | Tragic 32.1% |
| Immigrants | Nicaragua | 0.2 /100 | #270 | Tragic 31.9% |
| Central Americans | 0.2 /100 | #271 | Tragic 31.9% |
| Comanche | 0.2 /100 | #272 | Tragic 31.9% |
| Americans | 0.2 /100 | #273 | Tragic 31.9% |
| Potawatomi | 0.2 /100 | #274 | Tragic 31.9% |
| Samoans | 0.1 /100 | #275 | Tragic 31.8% |
Demographics Similar to Immigrants from South Central Asia by Bachelor's Degree
In terms of bachelor's degree, the demographic groups most similar to Immigrants from South Central Asia are Immigrants from China (48.4%, a difference of 0.14%), Immigrants from Hong Kong (48.2%, a difference of 0.28%), Immigrants from Australia (48.5%, a difference of 0.32%), Immigrants from Eastern Asia (48.1%, a difference of 0.42%), and Soviet Union (47.9%, a difference of 0.88%).
| Demographics | Rating | Rank | Bachelor's Degree |
| Okinawans | 100.0 /100 | #6 | Exceptional 50.5% |
| Immigrants | Iran | 100.0 /100 | #7 | Exceptional 50.3% |
| Thais | 100.0 /100 | #8 | Exceptional 50.1% |
| Immigrants | Israel | 100.0 /100 | #9 | Exceptional 50.0% |
| Cypriots | 100.0 /100 | #10 | Exceptional 49.0% |
| Immigrants | Australia | 100.0 /100 | #11 | Exceptional 48.5% |
| Immigrants | China | 100.0 /100 | #12 | Exceptional 48.4% |
| Immigrants | South Central Asia | 100.0 /100 | #13 | Exceptional 48.3% |
| Immigrants | Hong Kong | 100.0 /100 | #14 | Exceptional 48.2% |
| Immigrants | Eastern Asia | 100.0 /100 | #15 | Exceptional 48.1% |
| Soviet Union | 100.0 /100 | #16 | Exceptional 47.9% |
| Eastern Europeans | 100.0 /100 | #17 | Exceptional 47.5% |
| Indians (Asian) | 100.0 /100 | #18 | Exceptional 47.4% |
| Cambodians | 100.0 /100 | #19 | Exceptional 47.2% |
| Immigrants | Switzerland | 100.0 /100 | #20 | Exceptional 47.1% |