Immigrants from Portugal vs Bangladeshi Bachelor's Degree
COMPARE
Immigrants from Portugal
Bangladeshi
Bachelor's Degree
Bachelor's Degree Comparison
Immigrants from Portugal
Bangladeshis
32.2%
BACHELOR'S DEGREE
0.2/ 100
METRIC RATING
268th/ 347
METRIC RANK
30.2%
BACHELOR'S DEGREE
0.0/ 100
METRIC RATING
303rd/ 347
METRIC RANK
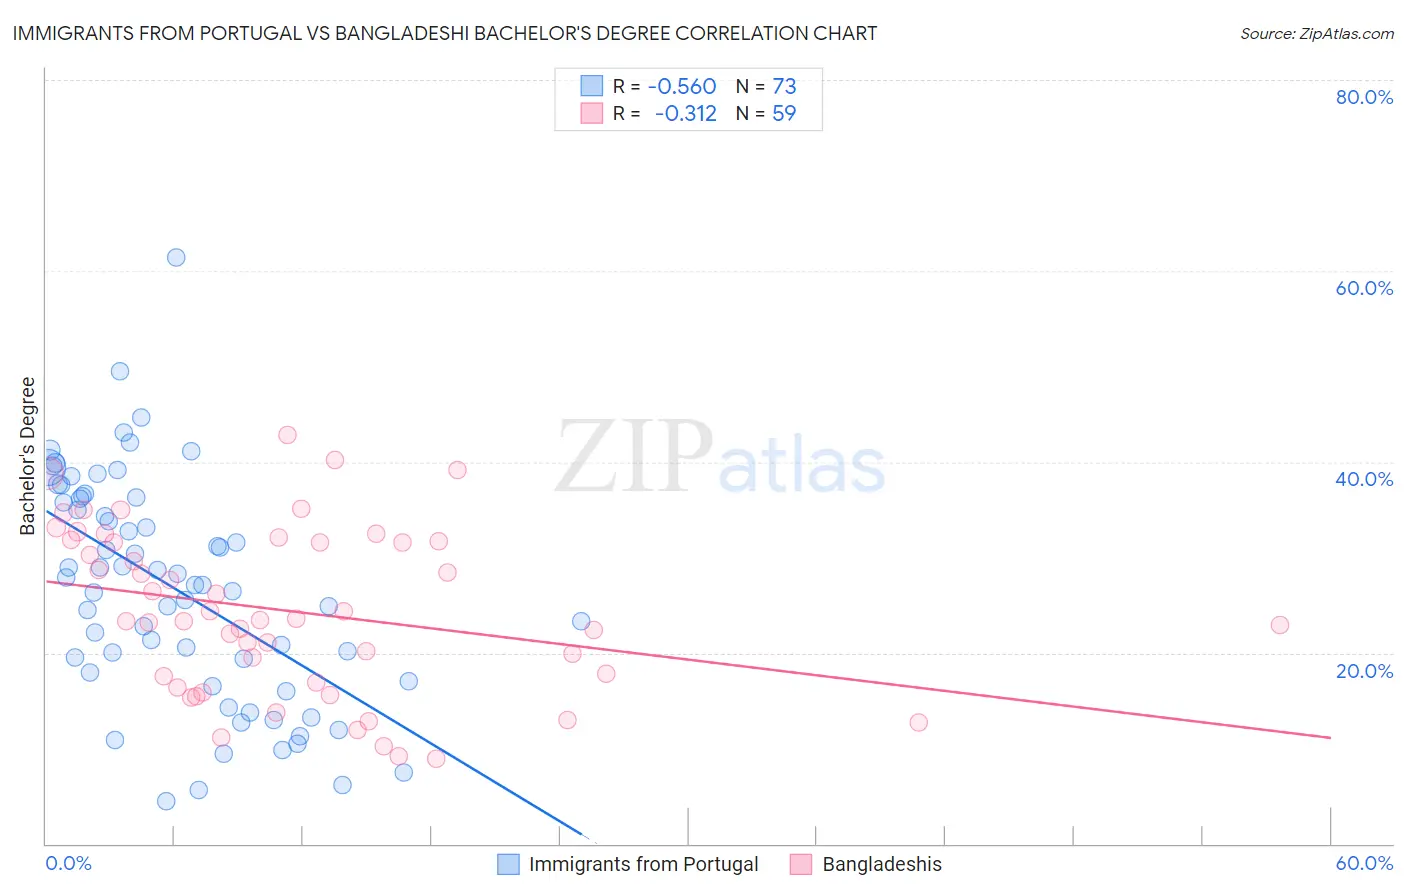
Immigrants from Portugal vs Bangladeshi Bachelor's Degree Correlation Chart
The statistical analysis conducted on geographies consisting of 174,788,694 people shows a substantial negative correlation between the proportion of Immigrants from Portugal and percentage of population with at least bachelor's degree education in the United States with a correlation coefficient (R) of -0.560 and weighted average of 32.2%. Similarly, the statistical analysis conducted on geographies consisting of 141,448,336 people shows a mild negative correlation between the proportion of Bangladeshis and percentage of population with at least bachelor's degree education in the United States with a correlation coefficient (R) of -0.312 and weighted average of 30.2%, a difference of 6.8%.
Bachelor's Degree Correlation Summary
| Measurement | Immigrants from Portugal | Bangladeshi |
| Minimum | 4.4% | 8.9% |
| Maximum | 61.4% | 42.8% |
| Range | 57.0% | 33.9% |
| Mean | 26.7% | 24.4% |
| Median | 27.2% | 23.4% |
| Interquartile 25% (IQ1) | 17.5% | 16.8% |
| Interquartile 75% (IQ3) | 36.2% | 31.7% |
| Interquartile Range (IQR) | 18.7% | 14.8% |
| Standard Deviation (Sample) | 11.7% | 8.6% |
| Standard Deviation (Population) | 11.6% | 8.6% |
Similar Demographics by Bachelor's Degree
Demographics Similar to Immigrants from Portugal by Bachelor's Degree
In terms of bachelor's degree, the demographic groups most similar to Immigrants from Portugal are Immigrants from Belize (32.1%, a difference of 0.41%), Cuban (32.5%, a difference of 0.76%), Immigrants from Dominica (32.5%, a difference of 0.88%), Bahamian (32.5%, a difference of 0.91%), and Central American Indian (32.5%, a difference of 0.94%).
| Demographics | Rating | Rank | Bachelor's Degree |
| Africans | 0.5 /100 | #261 | Tragic 32.9% |
| Immigrants | Jamaica | 0.5 /100 | #262 | Tragic 32.9% |
| Belizeans | 0.4 /100 | #263 | Tragic 32.8% |
| Central American Indians | 0.3 /100 | #264 | Tragic 32.5% |
| Bahamians | 0.3 /100 | #265 | Tragic 32.5% |
| Immigrants | Dominica | 0.3 /100 | #266 | Tragic 32.5% |
| Cubans | 0.3 /100 | #267 | Tragic 32.5% |
| Immigrants | Portugal | 0.2 /100 | #268 | Tragic 32.2% |
| Immigrants | Belize | 0.2 /100 | #269 | Tragic 32.1% |
| Immigrants | Nicaragua | 0.2 /100 | #270 | Tragic 31.9% |
| Central Americans | 0.2 /100 | #271 | Tragic 31.9% |
| Comanche | 0.2 /100 | #272 | Tragic 31.9% |
| Americans | 0.2 /100 | #273 | Tragic 31.9% |
| Potawatomi | 0.2 /100 | #274 | Tragic 31.9% |
| Samoans | 0.1 /100 | #275 | Tragic 31.8% |
Demographics Similar to Bangladeshis by Bachelor's Degree
In terms of bachelor's degree, the demographic groups most similar to Bangladeshis are Cherokee (30.2%, a difference of 0.010%), Mexican American Indian (30.2%, a difference of 0.17%), Immigrants from Latin America (30.1%, a difference of 0.43%), Immigrants from Cuba (30.3%, a difference of 0.45%), and Immigrants from Micronesia (30.4%, a difference of 0.66%).
| Demographics | Rating | Rank | Bachelor's Degree |
| Puget Sound Salish | 0.0 /100 | #296 | Tragic 30.7% |
| Immigrants | Haiti | 0.0 /100 | #297 | Tragic 30.6% |
| Chippewa | 0.0 /100 | #298 | Tragic 30.6% |
| Chickasaw | 0.0 /100 | #299 | Tragic 30.4% |
| Immigrants | Micronesia | 0.0 /100 | #300 | Tragic 30.4% |
| Immigrants | Cuba | 0.0 /100 | #301 | Tragic 30.3% |
| Mexican American Indians | 0.0 /100 | #302 | Tragic 30.2% |
| Bangladeshis | 0.0 /100 | #303 | Tragic 30.2% |
| Cherokee | 0.0 /100 | #304 | Tragic 30.2% |
| Immigrants | Latin America | 0.0 /100 | #305 | Tragic 30.1% |
| Immigrants | Yemen | 0.0 /100 | #306 | Tragic 29.9% |
| Nepalese | 0.0 /100 | #307 | Tragic 29.9% |
| Cajuns | 0.0 /100 | #308 | Tragic 29.6% |
| Hispanics or Latinos | 0.0 /100 | #309 | Tragic 29.6% |
| Cheyenne | 0.0 /100 | #310 | Tragic 29.4% |