Immigrants from Portugal vs Cree Bachelor's Degree

COMPARE

Immigrants from Portugal
Race
Ancestry
AfghanAfricanAlaska NativeAlaskan AthabascanAlbanianAleutAlsatianAmericanApacheArabArapahoArgentineanArmenianAssyrian/Chaldean/SyriacAustralianAustrianBahamianBangladeshiBarbadianBasqueBelgianBelizeanBermudanBhutaneseBlackfeetBolivianBrazilianBritishBritish West IndianBulgarianBurmeseCajunCambodianCanadianCape VerdeanCarpatho RusynCelticCentral AmericanCentral American IndianCherokeeCheyenneChickasawChileanChineseChippewaChoctawColombianColvilleComancheCosta RicanCreekCroatianCrowCubanCypriotCzechCzechoslovakianDanishDelawareDominicanDutchDutch West IndianEastern EuropeanEcuadorianEgyptianEnglishEstonianEthiopianEuropeanFijianFilipinoFinnishFrenchFrench American IndianFrench CanadianGermanGerman RussianGhanaianGreekGuamanian/ChamorroGuatemalanGuyaneseHaitianHmongHonduranHopiHoumaHungarianIcelanderIndian (Asian)IndonesianInupiatIranianIraqiIrishIroquoisIsraeliItalianJamaicanJapaneseJordanianKenyanKiowaKoreanLaotianLatvianLebaneseLiberianLithuanianLumbeeLuxembourgerMacedonianMalaysianMalteseMarshalleseMenomineeMexicanMexican American IndianMongolianMoroccanNative HawaiianNavajoNepaleseNew ZealanderNicaraguanNigerianNorthern EuropeanNorwegianOkinawanOsageOttawaPaiutePakistaniPalestinianPanamanianParaguayanPennsylvania GermanPeruvianPimaPolishPortuguesePotawatomiPuebloPuerto RicanPuget Sound SalishRomanianRussianSalvadoranSamoanScandinavianScotch-IrishScottishSeminoleSenegaleseSerbianShoshoneSierra LeoneanSiouxSlavicSlovakSloveneSomaliSouth AfricanSouth AmericanSouth American IndianSoviet UnionSpaniardSpanishSpanish AmericanSpanish American IndianSri LankanSubsaharan AfricanSudaneseSwedishSwissSyrianTaiwaneseThaiTlingit-HaidaTohono O'OdhamTonganTrinidadian and TobagonianTsimshianTurkishU.S. Virgin IslanderUgandanUkrainianUruguayanUteVenezuelanVietnameseWelshWest IndianYakamaYaquiYugoslavianYumanYup'ikZimbabwean
Immigration
NonimmigrantsImmigrantsAfghanistanAfricaAlbaniaArgentinaArmeniaAsiaAustraliaAustriaBahamasBangladeshBarbadosBelarusBelgiumBelizeBoliviaBosnia and HerzegovinaBrazilBulgariaBurma/MyanmarCabo VerdeCambodiaCameroonCanadaCaribbeanCentral AmericaChileChinaColombiaCongoCosta RicaCroatiaCubaCzechoslovakiaDenmarkDominicaDominican RepublicEastern AfricaEastern AsiaEastern EuropeEcuadorEgyptEl SalvadorEnglandEritreaEthiopiaEuropeFijiFranceGermanyGhanaGreeceGrenadaGuatemalaGuyanaHaitiHondurasHong KongHungaryIndiaIndonesiaIranIraqIrelandIsraelItalyJamaicaJapanJordanKazakhstanKenyaKoreaKuwaitLaosLatin AmericaLatviaLebanonLiberiaLithuaniaMalaysiaMexicoMicronesiaMiddle AfricaMoldovaMoroccoNepalNetherlandsNicaraguaNigeriaNorth AmericaNorth MacedoniaNorthern AfricaNorthern EuropeNorwayOceaniaPakistanPanamaPeruPhilippinesPolandPortugalRomaniaRussiaSaudi ArabiaScotlandSenegalSerbiaSierra LeoneSingaporeSomaliaSouth AfricaSouth AmericaSouth Central AsiaSouth Eastern AsiaSouthern EuropeSpainSri LankaSt. Vincent and the GrenadinesSudanSwedenSwitzerlandSyriaTaiwanThailandTrinidad and TobagoTurkeyUgandaUkraineUruguayUzbekistanVenezuelaVietnamWest IndiesWestern AfricaWestern AsiaWestern EuropeYemenZaireZimbabweAzores
Cree
Race
Ancestry
AfghanAfricanAlaska NativeAlaskan AthabascanAlbanianAleutAlsatianAmericanApacheArabArapahoArgentineanArmenianAssyrian/Chaldean/SyriacAustralianAustrianBahamianBangladeshiBarbadianBasqueBelgianBelizeanBermudanBhutaneseBlackfeetBolivianBrazilianBritishBritish West IndianBulgarianBurmeseCajunCambodianCanadianCape VerdeanCarpatho RusynCelticCentral AmericanCentral American IndianCherokeeCheyenneChickasawChileanChineseChippewaChoctawColombianColvilleComancheCosta RicanCreeCreekCroatianCrowCubanCypriotCzechCzechoslovakianDanishDelawareDominicanDutchDutch West IndianEastern EuropeanEcuadorianEgyptianEnglishEstonianEthiopianEuropeanFijianFilipinoFinnishFrenchFrench American IndianFrench CanadianGermanGerman RussianGhanaianGreekGuamanian/ChamorroGuatemalanGuyaneseHaitianHmongHonduranHopiHoumaHungarianIcelanderIndian (Asian)IndonesianInupiatIranianIraqiIrishIroquoisIsraeliItalianJamaicanJapaneseJordanianKenyanKiowaKoreanLaotianLatvianLebaneseLiberianLithuanianLumbeeLuxembourgerMacedonianMalaysianMalteseMarshalleseMenomineeMexicanMexican American IndianMongolianMoroccanNative HawaiianNavajoNepaleseNew ZealanderNicaraguanNigerianNorthern EuropeanNorwegianOkinawanOsageOttawaPaiutePakistaniPalestinianPanamanianParaguayanPennsylvania GermanPeruvianPimaPolishPortuguesePotawatomiPuebloPuerto RicanPuget Sound SalishRomanianRussianSalvadoranSamoanScandinavianScotch-IrishScottishSeminoleSenegaleseSerbianShoshoneSierra LeoneanSiouxSlavicSlovakSloveneSomaliSouth AfricanSouth AmericanSouth American IndianSoviet UnionSpaniardSpanishSpanish AmericanSpanish American IndianSri LankanSubsaharan AfricanSudaneseSwedishSwissSyrianTaiwaneseThaiTlingit-HaidaTohono O'OdhamTonganTrinidadian and TobagonianTsimshianTurkishU.S. Virgin IslanderUgandanUkrainianUruguayanUteVenezuelanVietnameseWelshWest IndianYakamaYaquiYugoslavianYumanYup'ikZimbabwean
Immigration
NonimmigrantsImmigrantsAfghanistanAfricaAlbaniaArgentinaArmeniaAsiaAustraliaAustriaBahamasBangladeshBarbadosBelarusBelgiumBelizeBoliviaBosnia and HerzegovinaBrazilBulgariaBurma/MyanmarCabo VerdeCambodiaCameroonCanadaCaribbeanCentral AmericaChileChinaColombiaCongoCosta RicaCroatiaCubaCzechoslovakiaDenmarkDominicaDominican RepublicEastern AfricaEastern AsiaEastern EuropeEcuadorEgyptEl SalvadorEnglandEritreaEthiopiaEuropeFijiFranceGermanyGhanaGreeceGrenadaGuatemalaGuyanaHaitiHondurasHong KongHungaryIndiaIndonesiaIranIraqIrelandIsraelItalyJamaicaJapanJordanKazakhstanKenyaKoreaKuwaitLaosLatin AmericaLatviaLebanonLiberiaLithuaniaMalaysiaMexicoMicronesiaMiddle AfricaMoldovaMoroccoNepalNetherlandsNicaraguaNigeriaNorth AmericaNorth MacedoniaNorthern AfricaNorthern EuropeNorwayOceaniaPakistanPanamaPeruPhilippinesPolandRomaniaRussiaSaudi ArabiaScotlandSenegalSerbiaSierra LeoneSingaporeSomaliaSouth AfricaSouth AmericaSouth Central AsiaSouth Eastern AsiaSouthern EuropeSpainSri LankaSt. Vincent and the GrenadinesSudanSwedenSwitzerlandSyriaTaiwanThailandTrinidad and TobagoTurkeyUgandaUkraineUruguayUzbekistanVenezuelaVietnamWest IndiesWestern AfricaWestern AsiaWestern EuropeYemenZaireZimbabweAzores
Bachelor's Degree
Income
Poverty
Unemployment
Labor Participation
Family Structure
Vehicle Availability
Education Level
Disability

Bachelor's Degree Comparison

Immigrants from Portugal

Cree

Tragic
Tragic
32.2%
BACHELOR'S DEGREE
0.2/ 100
METRIC RATING
268th/ 347
METRIC RANK
33.6%
BACHELOR'S DEGREE
1.0/ 100
METRIC RATING
248th/ 347
METRIC RANK

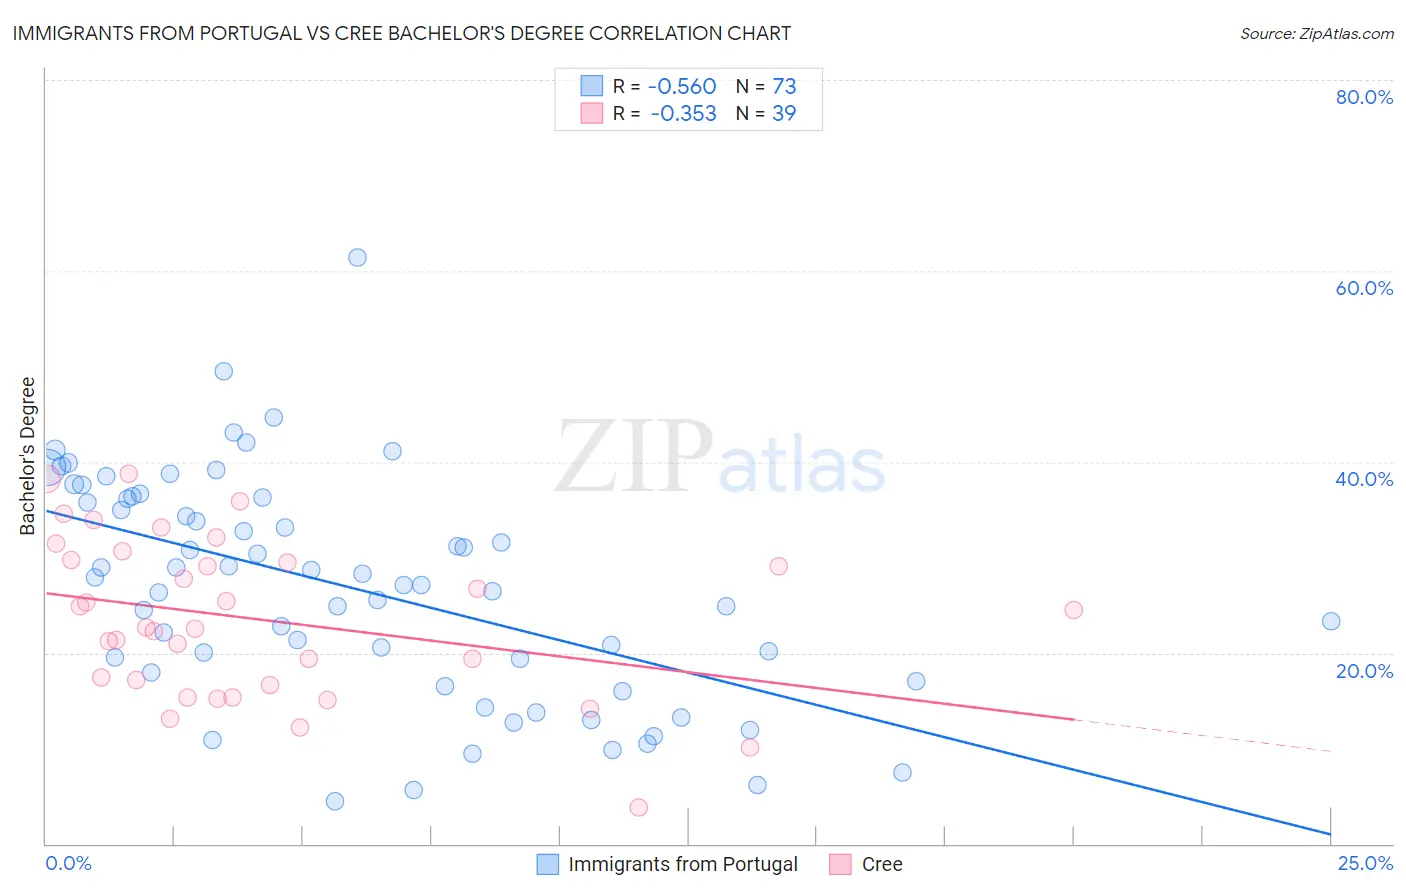
Immigrants from Portugal vs Cree Bachelor's Degree Correlation Chart

The statistical analysis conducted on geographies consisting of 174,788,694 people shows a substantial negative correlation between the proportion of Immigrants from Portugal and percentage of population with at least bachelor's degree education in the United States with a correlation coefficient (R) of -0.560 and weighted average of 32.2%. Similarly, the statistical analysis conducted on geographies consisting of 76,210,625 people shows a mild negative correlation between the proportion of Cree and percentage of population with at least bachelor's degree education in the United States with a correlation coefficient (R) of -0.353 and weighted average of 33.6%, a difference of 4.2%.
Immigrants from Portugal vs Cree Bachelor's Degree

Bachelor's Degree Correlation Summary

MeasurementImmigrants from PortugalCree
Minimum4.4%3.8%
Maximum61.4%38.7%
Range57.0%34.9%
Mean26.7%23.5%
Median27.2%22.6%
Interquartile 25% (IQ1)17.5%16.6%
Interquartile 75% (IQ3)36.2%29.7%
Interquartile Range (IQR)18.7%13.1%
Standard Deviation (Sample)11.7%8.3%
Standard Deviation (Population)11.6%8.2%

Demographics Similar to Immigrants from Portugal and Cree by Bachelor's Degree

In terms of bachelor's degree, the demographic groups most similar to Immigrants from Portugal are Cuban (32.5%, a difference of 0.76%), Immigrants from Dominica (32.5%, a difference of 0.88%), Bahamian (32.5%, a difference of 0.91%), Central American Indian (32.5%, a difference of 0.94%), and Belizean (32.8%, a difference of 1.7%). Similarly, the demographic groups most similar to Cree are Immigrants from Liberia (33.5%, a difference of 0.13%), Indonesian (33.5%, a difference of 0.13%), Japanese (33.3%, a difference of 0.77%), Immigrants from Bahamas (33.3%, a difference of 0.84%), and U.S. Virgin Islander (33.2%, a difference of 1.1%).
DemographicsRating | RankBachelor's Degree
Cree
1.0
/100
|
#248
Tragic
33.6%
Immigrants | Liberia
0.9
/100
|
#249
Tragic
33.5%
Indonesians
0.9
/100
|
#250
Tragic
33.5%
Japanese
0.7
/100
|
#251
Tragic
33.3%
Immigrants | Bahamas
0.7
/100
|
#252
Tragic
33.3%
U.S. Virgin Islanders
0.7
/100
|
#253
Tragic
33.2%
Native Hawaiians
0.7
/100
|
#254
Tragic
33.2%
Iroquois
0.7
/100
|
#255
Tragic
33.2%
Nicaraguans
0.6
/100
|
#256
Tragic
33.1%
Spanish Americans
0.6
/100
|
#257
Tragic
33.1%
French American Indians
0.6
/100
|
#258
Tragic
33.1%
Osage
0.5
/100
|
#259
Tragic
33.0%
Malaysians
0.5
/100
|
#260
Tragic
32.9%
Africans
0.5
/100
|
#261
Tragic
32.9%
Immigrants | Jamaica
0.5
/100
|
#262
Tragic
32.9%
Belizeans
0.4
/100
|
#263
Tragic
32.8%
Central American Indians
0.3
/100
|
#264
Tragic
32.5%
Bahamians
0.3
/100
|
#265
Tragic
32.5%
Immigrants | Dominica
0.3
/100
|
#266
Tragic
32.5%
Cubans
0.3
/100
|
#267
Tragic
32.5%
Immigrants | Portugal
0.2
/100
|
#268
Tragic
32.2%