Immigrants from Peru vs Luxembourger No Schooling Completed
COMPARE
Immigrants from Peru
Luxembourger
No Schooling Completed
No Schooling Completed Comparison
Immigrants from Peru
Luxembourgers
2.5%
NO SCHOOLING COMPLETED
0.2/ 100
METRIC RATING
270th/ 347
METRIC RANK
1.6%
NO SCHOOLING COMPLETED
99.9/ 100
METRIC RATING
40th/ 347
METRIC RANK
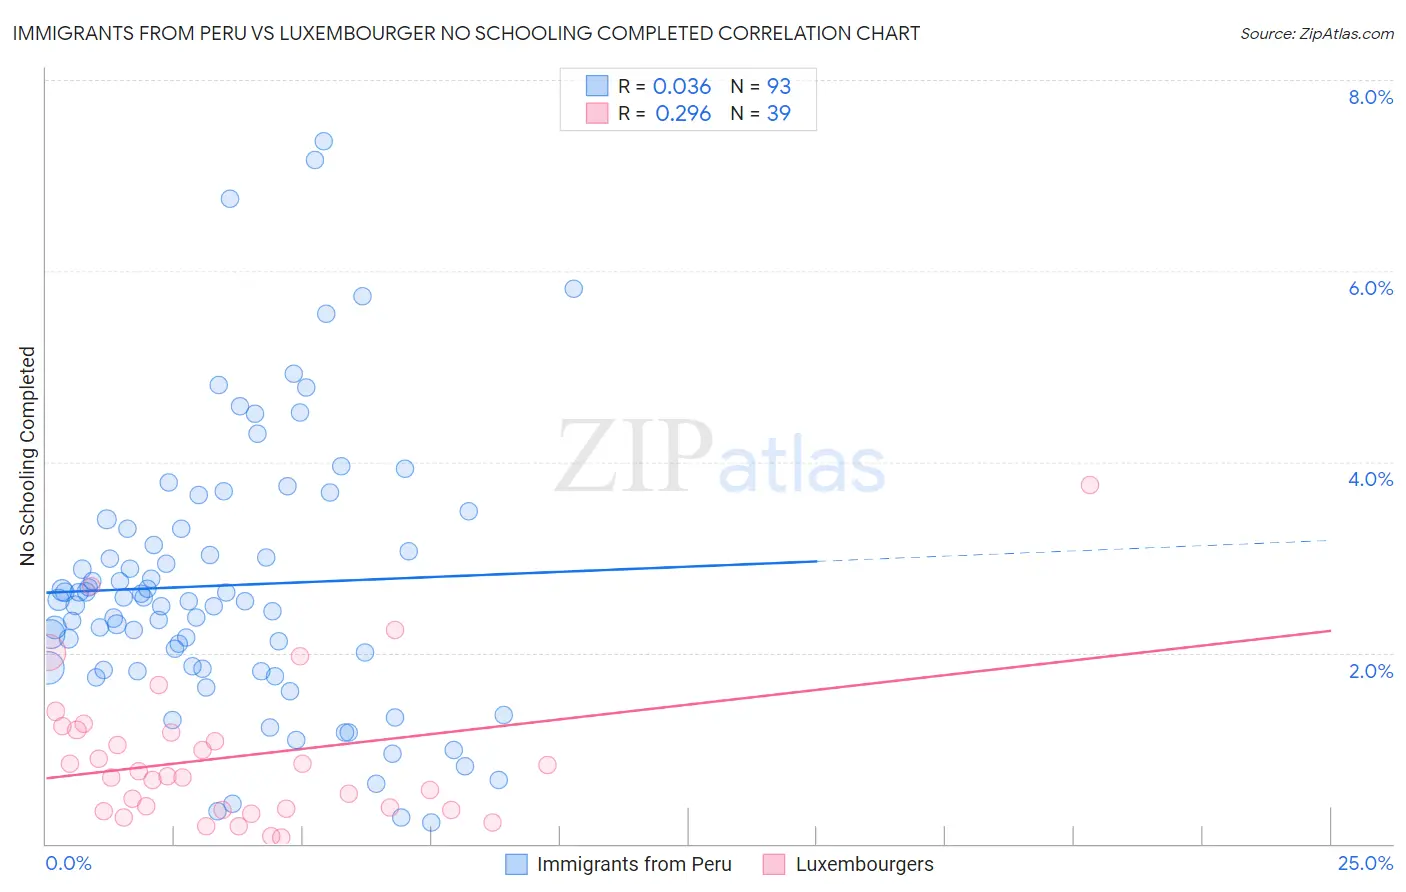
Immigrants from Peru vs Luxembourger No Schooling Completed Correlation Chart
The statistical analysis conducted on geographies consisting of 326,728,485 people shows no correlation between the proportion of Immigrants from Peru and percentage of population with no schooling in the United States with a correlation coefficient (R) of 0.036 and weighted average of 2.5%. Similarly, the statistical analysis conducted on geographies consisting of 143,533,879 people shows a weak positive correlation between the proportion of Luxembourgers and percentage of population with no schooling in the United States with a correlation coefficient (R) of 0.296 and weighted average of 1.6%, a difference of 58.3%.
No Schooling Completed Correlation Summary
| Measurement | Immigrants from Peru | Luxembourger |
| Minimum | 0.23% | 0.062% |
| Maximum | 7.4% | 3.8% |
| Range | 7.1% | 3.7% |
| Mean | 2.7% | 0.91% |
| Median | 2.5% | 0.71% |
| Interquartile 25% (IQ1) | 1.8% | 0.36% |
| Interquartile 75% (IQ3) | 3.3% | 1.2% |
| Interquartile Range (IQR) | 1.5% | 0.83% |
| Standard Deviation (Sample) | 1.4% | 0.77% |
| Standard Deviation (Population) | 1.4% | 0.76% |
Similar Demographics by No Schooling Completed
Demographics Similar to Immigrants from Peru by No Schooling Completed
In terms of no schooling completed, the demographic groups most similar to Immigrants from Peru are Cuban (2.5%, a difference of 0.010%), Immigrants from Nigeria (2.5%, a difference of 0.080%), Immigrants from Bolivia (2.5%, a difference of 0.54%), Taiwanese (2.5%, a difference of 0.94%), and Yuman (2.5%, a difference of 1.2%).
| Demographics | Rating | Rank | No Schooling Completed |
| Immigrants | Liberia | 0.4 /100 | #263 | Tragic 2.5% |
| Indians (Asian) | 0.4 /100 | #264 | Tragic 2.5% |
| West Indians | 0.4 /100 | #265 | Tragic 2.5% |
| Fijians | 0.4 /100 | #266 | Tragic 2.5% |
| Yuman | 0.4 /100 | #267 | Tragic 2.5% |
| Taiwanese | 0.3 /100 | #268 | Tragic 2.5% |
| Immigrants | Nigeria | 0.2 /100 | #269 | Tragic 2.5% |
| Immigrants | Peru | 0.2 /100 | #270 | Tragic 2.5% |
| Cubans | 0.2 /100 | #271 | Tragic 2.5% |
| Immigrants | Bolivia | 0.2 /100 | #272 | Tragic 2.5% |
| Immigrants | Cameroon | 0.1 /100 | #273 | Tragic 2.5% |
| Ghanaians | 0.1 /100 | #274 | Tragic 2.6% |
| Immigrants | China | 0.1 /100 | #275 | Tragic 2.6% |
| Immigrants | Western Africa | 0.1 /100 | #276 | Tragic 2.6% |
| Immigrants | Philippines | 0.1 /100 | #277 | Tragic 2.6% |
Demographics Similar to Luxembourgers by No Schooling Completed
In terms of no schooling completed, the demographic groups most similar to Luxembourgers are Hungarian (1.6%, a difference of 0.27%), Native Hawaiian (1.6%, a difference of 0.35%), Northern European (1.6%, a difference of 0.61%), Belgian (1.6%, a difference of 0.75%), and Aleut (1.6%, a difference of 1.0%).
| Demographics | Rating | Rank | No Schooling Completed |
| Italians | 100.0 /100 | #33 | Exceptional 1.5% |
| Latvians | 100.0 /100 | #34 | Exceptional 1.5% |
| Eastern Europeans | 100.0 /100 | #35 | Exceptional 1.6% |
| Aleuts | 99.9 /100 | #36 | Exceptional 1.6% |
| Belgians | 99.9 /100 | #37 | Exceptional 1.6% |
| Northern Europeans | 99.9 /100 | #38 | Exceptional 1.6% |
| Native Hawaiians | 99.9 /100 | #39 | Exceptional 1.6% |
| Luxembourgers | 99.9 /100 | #40 | Exceptional 1.6% |
| Hungarians | 99.9 /100 | #41 | Exceptional 1.6% |
| Bulgarians | 99.9 /100 | #42 | Exceptional 1.6% |
| Australians | 99.9 /100 | #43 | Exceptional 1.6% |
| Estonians | 99.9 /100 | #44 | Exceptional 1.6% |
| Czechoslovakians | 99.9 /100 | #45 | Exceptional 1.6% |
| Maltese | 99.9 /100 | #46 | Exceptional 1.6% |
| Ottawa | 99.9 /100 | #47 | Exceptional 1.6% |