Immigrants from Peru vs Immigrants from Yemen Bachelor's Degree
COMPARE
Immigrants from Peru
Immigrants from Yemen
Bachelor's Degree
Bachelor's Degree Comparison
Immigrants from Peru
Immigrants from Yemen
37.5%
BACHELOR'S DEGREE
41.3/ 100
METRIC RATING
185th/ 347
METRIC RANK
29.9%
BACHELOR'S DEGREE
0.0/ 100
METRIC RATING
306th/ 347
METRIC RANK
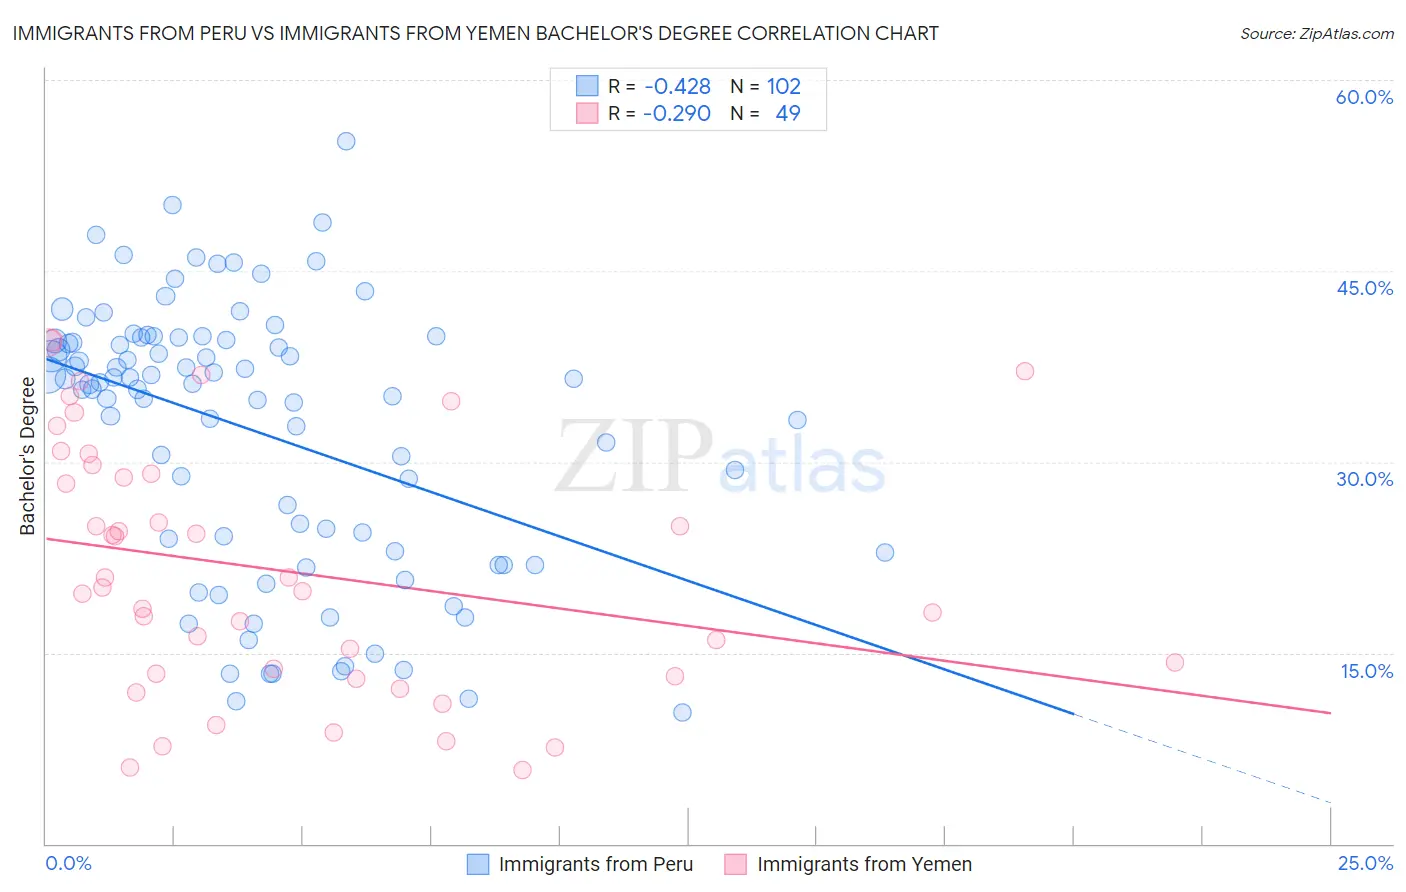
Immigrants from Peru vs Immigrants from Yemen Bachelor's Degree Correlation Chart
The statistical analysis conducted on geographies consisting of 328,855,740 people shows a moderate negative correlation between the proportion of Immigrants from Peru and percentage of population with at least bachelor's degree education in the United States with a correlation coefficient (R) of -0.428 and weighted average of 37.5%. Similarly, the statistical analysis conducted on geographies consisting of 82,429,885 people shows a weak negative correlation between the proportion of Immigrants from Yemen and percentage of population with at least bachelor's degree education in the United States with a correlation coefficient (R) of -0.290 and weighted average of 29.9%, a difference of 25.4%.
Bachelor's Degree Correlation Summary
| Measurement | Immigrants from Peru | Immigrants from Yemen |
| Minimum | 10.3% | 5.8% |
| Maximum | 55.2% | 39.6% |
| Range | 44.9% | 33.8% |
| Mean | 32.4% | 21.5% |
| Median | 36.1% | 20.1% |
| Interquartile 25% (IQ1) | 23.0% | 13.3% |
| Interquartile 75% (IQ3) | 39.5% | 29.4% |
| Interquartile Range (IQR) | 16.5% | 16.1% |
| Standard Deviation (Sample) | 10.6% | 9.8% |
| Standard Deviation (Population) | 10.5% | 9.7% |
Similar Demographics by Bachelor's Degree
Demographics Similar to Immigrants from Peru by Bachelor's Degree
In terms of bachelor's degree, the demographic groups most similar to Immigrants from Peru are Scandinavian (37.5%, a difference of 0.040%), Senegalese (37.5%, a difference of 0.080%), Norwegian (37.5%, a difference of 0.10%), English (37.4%, a difference of 0.17%), and Immigrants from Bosnia and Herzegovina (37.6%, a difference of 0.21%).
| Demographics | Rating | Rank | Bachelor's Degree |
| Immigrants | Cameroon | 46.8 /100 | #178 | Average 37.7% |
| Immigrants | Colombia | 45.4 /100 | #179 | Average 37.7% |
| Irish | 44.3 /100 | #180 | Average 37.6% |
| Immigrants | Senegal | 43.8 /100 | #181 | Average 37.6% |
| Immigrants | Bosnia and Herzegovina | 43.4 /100 | #182 | Average 37.6% |
| Senegalese | 42.2 /100 | #183 | Average 37.5% |
| Scandinavians | 41.7 /100 | #184 | Average 37.5% |
| Immigrants | Peru | 41.3 /100 | #185 | Average 37.5% |
| Norwegians | 40.4 /100 | #186 | Average 37.5% |
| English | 39.7 /100 | #187 | Fair 37.4% |
| Immigrants | Oceania | 37.3 /100 | #188 | Fair 37.3% |
| Slovaks | 36.9 /100 | #189 | Fair 37.3% |
| Swiss | 34.1 /100 | #190 | Fair 37.2% |
| Nigerians | 33.9 /100 | #191 | Fair 37.2% |
| Immigrants | Vietnam | 32.1 /100 | #192 | Fair 37.1% |
Demographics Similar to Immigrants from Yemen by Bachelor's Degree
In terms of bachelor's degree, the demographic groups most similar to Immigrants from Yemen are Nepalese (29.9%, a difference of 0.040%), Immigrants from Latin America (30.1%, a difference of 0.55%), Cajun (29.6%, a difference of 0.89%), Cherokee (30.2%, a difference of 0.97%), and Bangladeshi (30.2%, a difference of 0.98%).
| Demographics | Rating | Rank | Bachelor's Degree |
| Chickasaw | 0.0 /100 | #299 | Tragic 30.4% |
| Immigrants | Micronesia | 0.0 /100 | #300 | Tragic 30.4% |
| Immigrants | Cuba | 0.0 /100 | #301 | Tragic 30.3% |
| Mexican American Indians | 0.0 /100 | #302 | Tragic 30.2% |
| Bangladeshis | 0.0 /100 | #303 | Tragic 30.2% |
| Cherokee | 0.0 /100 | #304 | Tragic 30.2% |
| Immigrants | Latin America | 0.0 /100 | #305 | Tragic 30.1% |
| Immigrants | Yemen | 0.0 /100 | #306 | Tragic 29.9% |
| Nepalese | 0.0 /100 | #307 | Tragic 29.9% |
| Cajuns | 0.0 /100 | #308 | Tragic 29.6% |
| Hispanics or Latinos | 0.0 /100 | #309 | Tragic 29.6% |
| Cheyenne | 0.0 /100 | #310 | Tragic 29.4% |
| Choctaw | 0.0 /100 | #311 | Tragic 29.4% |
| Seminole | 0.0 /100 | #312 | Tragic 29.4% |
| Alaska Natives | 0.0 /100 | #313 | Tragic 29.4% |