Immigrants from Panama vs Immigrants from Uganda In Labor Force | Age 30-34
COMPARE
Immigrants from Panama
Immigrants from Uganda
In Labor Force | Age 30-34
In Labor Force | Age 30-34 Comparison
Immigrants from Panama
Immigrants from Uganda
84.3%
IN LABOR FORCE | AGE 30-34
6.3/ 100
METRIC RATING
218th/ 347
METRIC RANK
85.2%
IN LABOR FORCE | AGE 30-34
97.2/ 100
METRIC RATING
98th/ 347
METRIC RANK
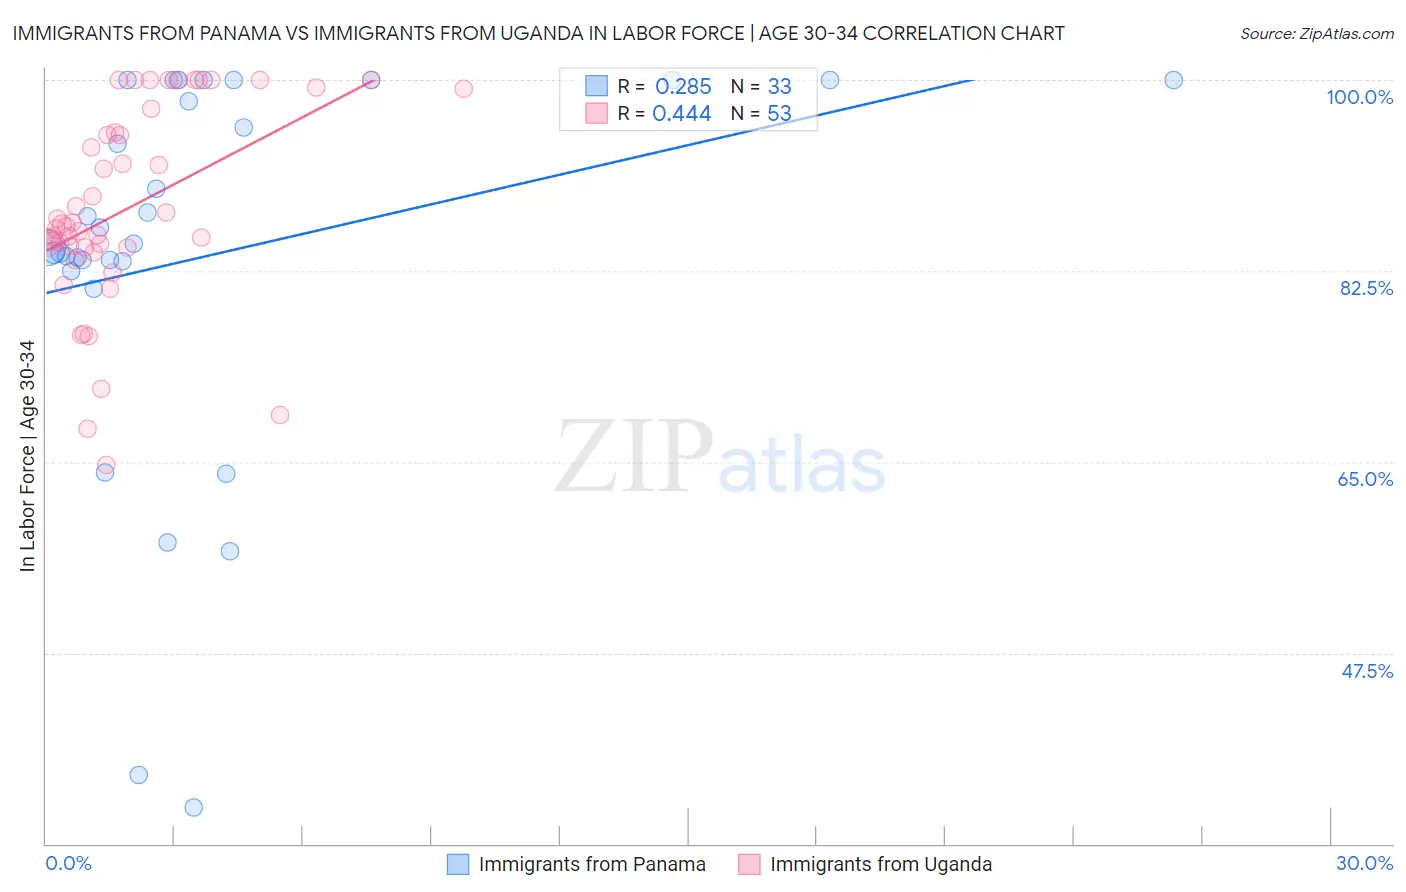
Immigrants from Panama vs Immigrants from Uganda In Labor Force | Age 30-34 Correlation Chart
The statistical analysis conducted on geographies consisting of 221,155,968 people shows a weak positive correlation between the proportion of Immigrants from Panama and labor force participation rate among population between the ages 30 and 34 in the United States with a correlation coefficient (R) of 0.285 and weighted average of 84.3%. Similarly, the statistical analysis conducted on geographies consisting of 125,970,881 people shows a moderate positive correlation between the proportion of Immigrants from Uganda and labor force participation rate among population between the ages 30 and 34 in the United States with a correlation coefficient (R) of 0.444 and weighted average of 85.2%, a difference of 1.1%.
In Labor Force | Age 30-34 Correlation Summary
| Measurement | Immigrants from Panama | Immigrants from Uganda |
| Minimum | 33.3% | 64.7% |
| Maximum | 100.0% | 100.0% |
| Range | 66.7% | 35.3% |
| Mean | 84.0% | 88.2% |
| Median | 85.0% | 86.6% |
| Interquartile 25% (IQ1) | 82.9% | 84.6% |
| Interquartile 75% (IQ3) | 100.0% | 96.3% |
| Interquartile Range (IQR) | 17.1% | 11.7% |
| Standard Deviation (Sample) | 17.6% | 9.0% |
| Standard Deviation (Population) | 17.3% | 8.9% |
Similar Demographics by In Labor Force | Age 30-34
Demographics Similar to Immigrants from Panama by In Labor Force | Age 30-34
In terms of in labor force | age 30-34, the demographic groups most similar to Immigrants from Panama are Immigrants from Ecuador (84.3%, a difference of 0.020%), Immigrants from Trinidad and Tobago (84.3%, a difference of 0.020%), Swiss (84.3%, a difference of 0.020%), Immigrants from Germany (84.3%, a difference of 0.030%), and European (84.3%, a difference of 0.030%).
| Demographics | Rating | Rank | In Labor Force | Age 30-34 |
| Japanese | 8.8 /100 | #211 | Tragic 84.3% |
| Immigrants | Western Asia | 8.2 /100 | #212 | Tragic 84.3% |
| Immigrants | Jamaica | 7.9 /100 | #213 | Tragic 84.3% |
| Immigrants | Germany | 7.2 /100 | #214 | Tragic 84.3% |
| Europeans | 7.2 /100 | #215 | Tragic 84.3% |
| Immigrants | Ecuador | 7.1 /100 | #216 | Tragic 84.3% |
| Immigrants | Trinidad and Tobago | 7.0 /100 | #217 | Tragic 84.3% |
| Immigrants | Panama | 6.3 /100 | #218 | Tragic 84.3% |
| Swiss | 5.8 /100 | #219 | Tragic 84.3% |
| Danes | 5.3 /100 | #220 | Tragic 84.3% |
| Salvadorans | 3.8 /100 | #221 | Tragic 84.2% |
| Panamanians | 3.8 /100 | #222 | Tragic 84.2% |
| Immigrants | Laos | 3.6 /100 | #223 | Tragic 84.2% |
| Cubans | 3.4 /100 | #224 | Tragic 84.2% |
| Scottish | 3.1 /100 | #225 | Tragic 84.2% |
Demographics Similar to Immigrants from Uganda by In Labor Force | Age 30-34
In terms of in labor force | age 30-34, the demographic groups most similar to Immigrants from Uganda are Immigrants from Korea (85.2%, a difference of 0.0%), Thai (85.2%, a difference of 0.0%), Belgian (85.2%, a difference of 0.0%), Sudanese (85.2%, a difference of 0.010%), and Swedish (85.2%, a difference of 0.020%).
| Demographics | Rating | Rank | In Labor Force | Age 30-34 |
| Immigrants | Moldova | 97.9 /100 | #91 | Exceptional 85.3% |
| German Russians | 97.7 /100 | #92 | Exceptional 85.2% |
| Immigrants | Norway | 97.6 /100 | #93 | Exceptional 85.2% |
| Swedes | 97.5 /100 | #94 | Exceptional 85.2% |
| Immigrants | India | 97.4 /100 | #95 | Exceptional 85.2% |
| Immigrants | Korea | 97.3 /100 | #96 | Exceptional 85.2% |
| Thais | 97.2 /100 | #97 | Exceptional 85.2% |
| Immigrants | Uganda | 97.2 /100 | #98 | Exceptional 85.2% |
| Belgians | 97.2 /100 | #99 | Exceptional 85.2% |
| Sudanese | 97.1 /100 | #100 | Exceptional 85.2% |
| Immigrants | Belarus | 96.9 /100 | #101 | Exceptional 85.2% |
| Immigrants | Austria | 96.8 /100 | #102 | Exceptional 85.2% |
| Ukrainians | 96.6 /100 | #103 | Exceptional 85.2% |
| Immigrants | Ghana | 96.5 /100 | #104 | Exceptional 85.2% |
| Alsatians | 96.3 /100 | #105 | Exceptional 85.2% |