Immigrants from Pakistan vs Ecuadorian Seniors Poverty Over the Age of 65
COMPARE
Immigrants from Pakistan
Ecuadorian
Seniors Poverty Over the Age of 65
Seniors Poverty Over the Age of 65 Comparison
Immigrants from Pakistan
Ecuadorians
10.2%
SENIORS POVERTY OVER THE AGE OF 65
95.7/ 100
METRIC RATING
97th/ 347
METRIC RANK
14.0%
SENIORS POVERTY OVER THE AGE OF 65
0.0/ 100
METRIC RATING
299th/ 347
METRIC RANK
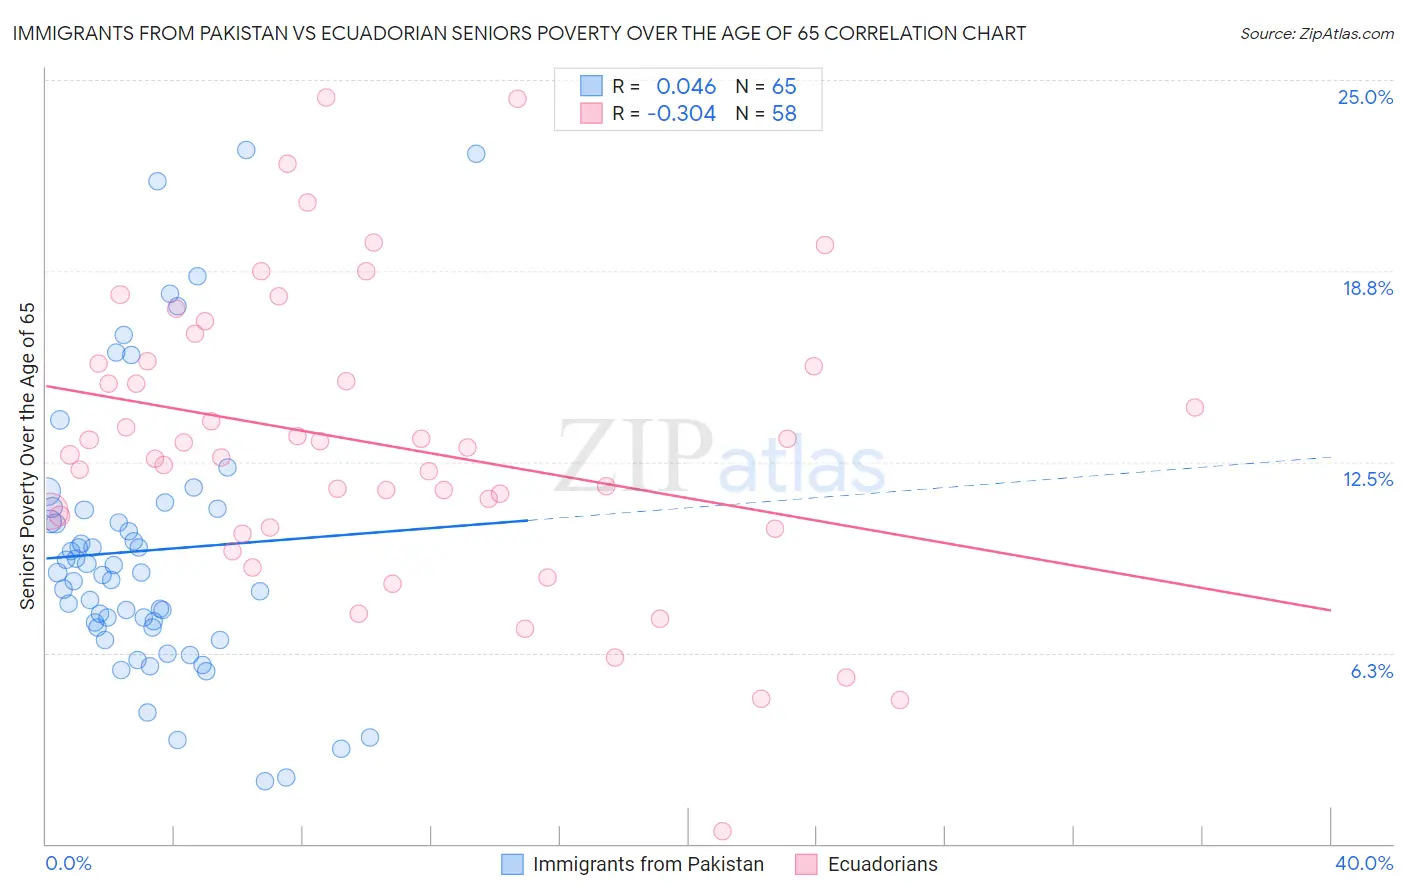
Immigrants from Pakistan vs Ecuadorian Seniors Poverty Over the Age of 65 Correlation Chart
The statistical analysis conducted on geographies consisting of 283,278,870 people shows no correlation between the proportion of Immigrants from Pakistan and poverty level among seniors over the age of 65 in the United States with a correlation coefficient (R) of 0.046 and weighted average of 10.2%. Similarly, the statistical analysis conducted on geographies consisting of 316,781,665 people shows a mild negative correlation between the proportion of Ecuadorians and poverty level among seniors over the age of 65 in the United States with a correlation coefficient (R) of -0.304 and weighted average of 14.0%, a difference of 37.6%.
Seniors Poverty Over the Age of 65 Correlation Summary
| Measurement | Immigrants from Pakistan | Ecuadorian |
| Minimum | 2.1% | 0.39% |
| Maximum | 22.7% | 24.4% |
| Range | 20.6% | 24.0% |
| Mean | 9.6% | 13.1% |
| Median | 8.9% | 12.9% |
| Interquartile 25% (IQ1) | 7.1% | 10.4% |
| Interquartile 75% (IQ3) | 11.0% | 15.7% |
| Interquartile Range (IQR) | 3.9% | 5.4% |
| Standard Deviation (Sample) | 4.5% | 4.8% |
| Standard Deviation (Population) | 4.5% | 4.8% |
Similar Demographics by Seniors Poverty Over the Age of 65
Demographics Similar to Immigrants from Pakistan by Seniors Poverty Over the Age of 65
In terms of seniors poverty over the age of 65, the demographic groups most similar to Immigrants from Pakistan are Basque (10.2%, a difference of 0.090%), Immigrants from Kuwait (10.2%, a difference of 0.16%), Cypriot (10.2%, a difference of 0.16%), Marshallese (10.2%, a difference of 0.23%), and Immigrants from Japan (10.1%, a difference of 0.37%).
| Demographics | Rating | Rank | Seniors Poverty Over the Age of 65 |
| Ukrainians | 96.9 /100 | #90 | Exceptional 10.1% |
| Puget Sound Salish | 96.9 /100 | #91 | Exceptional 10.1% |
| Immigrants | Singapore | 96.9 /100 | #92 | Exceptional 10.1% |
| Immigrants | Sweden | 96.7 /100 | #93 | Exceptional 10.1% |
| Immigrants | Germany | 96.7 /100 | #94 | Exceptional 10.1% |
| Immigrants | Japan | 96.3 /100 | #95 | Exceptional 10.1% |
| Basques | 95.9 /100 | #96 | Exceptional 10.2% |
| Immigrants | Pakistan | 95.7 /100 | #97 | Exceptional 10.2% |
| Immigrants | Kuwait | 95.5 /100 | #98 | Exceptional 10.2% |
| Cypriots | 95.5 /100 | #99 | Exceptional 10.2% |
| Marshallese | 95.3 /100 | #100 | Exceptional 10.2% |
| Immigrants | Jordan | 94.7 /100 | #101 | Exceptional 10.2% |
| Delaware | 94.5 /100 | #102 | Exceptional 10.2% |
| Icelanders | 94.4 /100 | #103 | Exceptional 10.3% |
| South Africans | 94.3 /100 | #104 | Exceptional 10.3% |
Demographics Similar to Ecuadorians by Seniors Poverty Over the Age of 65
In terms of seniors poverty over the age of 65, the demographic groups most similar to Ecuadorians are Immigrants from Belize (14.0%, a difference of 0.070%), Immigrants from Uzbekistan (14.0%, a difference of 0.070%), U.S. Virgin Islander (14.0%, a difference of 0.28%), Vietnamese (14.0%, a difference of 0.35%), and Yup'ik (14.1%, a difference of 0.36%).
| Demographics | Rating | Rank | Seniors Poverty Over the Age of 65 |
| Spanish American Indians | 0.0 /100 | #292 | Tragic 13.8% |
| Immigrants | Guatemala | 0.0 /100 | #293 | Tragic 13.8% |
| Cheyenne | 0.0 /100 | #294 | Tragic 13.9% |
| Apache | 0.0 /100 | #295 | Tragic 13.9% |
| Immigrants | Jamaica | 0.0 /100 | #296 | Tragic 13.9% |
| Vietnamese | 0.0 /100 | #297 | Tragic 14.0% |
| Immigrants | Belize | 0.0 /100 | #298 | Tragic 14.0% |
| Ecuadorians | 0.0 /100 | #299 | Tragic 14.0% |
| Immigrants | Uzbekistan | 0.0 /100 | #300 | Tragic 14.0% |
| U.S. Virgin Islanders | 0.0 /100 | #301 | Tragic 14.0% |
| Yup'ik | 0.0 /100 | #302 | Tragic 14.1% |
| Immigrants | Bangladesh | 0.0 /100 | #303 | Tragic 14.1% |
| West Indians | 0.0 /100 | #304 | Tragic 14.1% |
| Immigrants | Trinidad and Tobago | 0.0 /100 | #305 | Tragic 14.1% |
| Immigrants | Latin America | 0.0 /100 | #306 | Tragic 14.2% |