Immigrants from Norway vs Macedonian 5th Grade
COMPARE
Immigrants from Norway
Macedonian
5th Grade
5th Grade Comparison
Immigrants from Norway
Macedonians
97.6%
5TH GRADE
94.6/ 100
METRIC RATING
123rd/ 347
METRIC RANK
97.9%
5TH GRADE
99.4/ 100
METRIC RATING
72nd/ 347
METRIC RANK
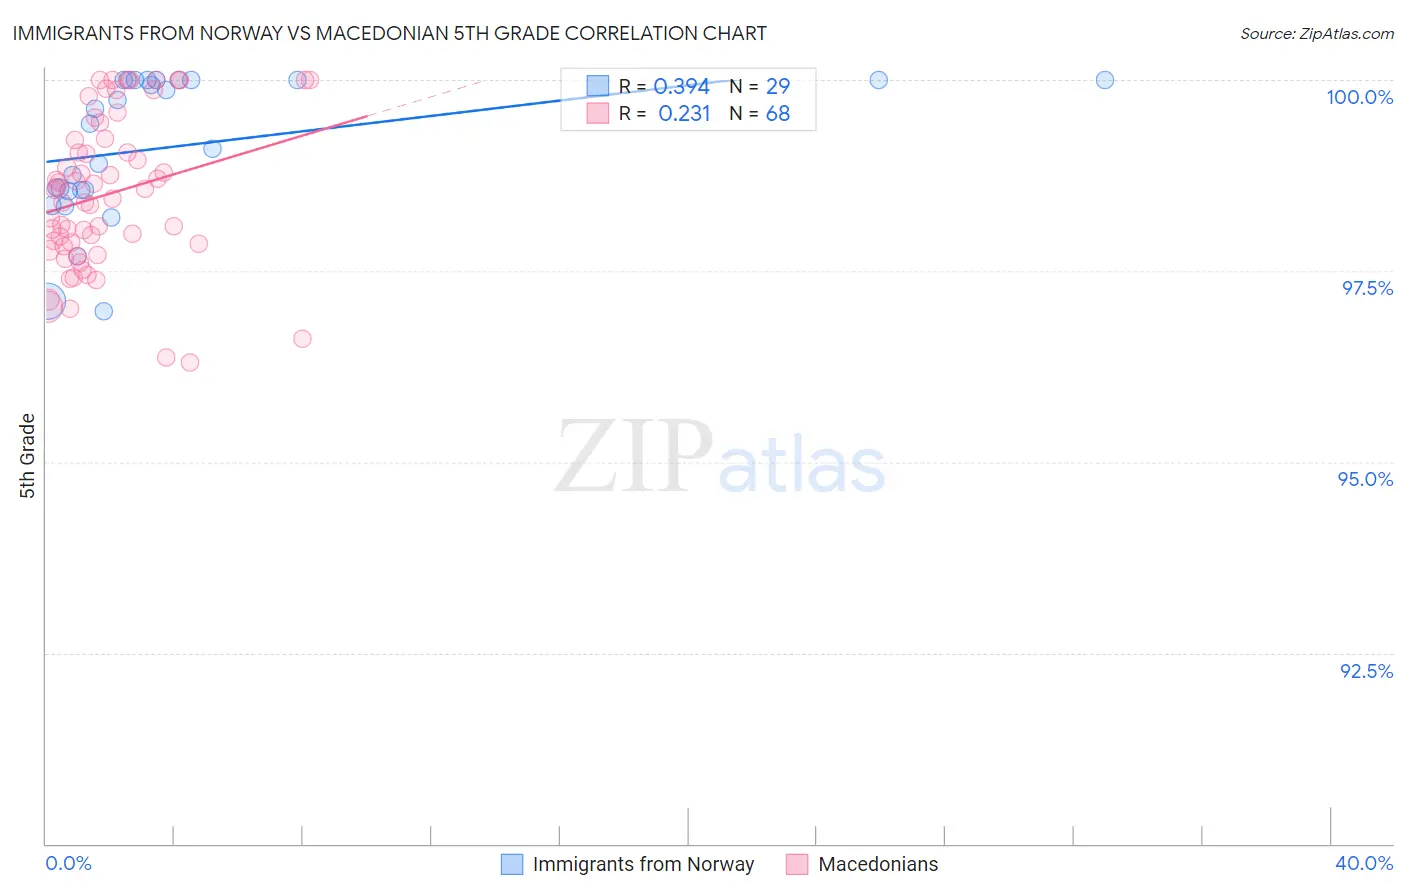
Immigrants from Norway vs Macedonian 5th Grade Correlation Chart
The statistical analysis conducted on geographies consisting of 116,716,420 people shows a mild positive correlation between the proportion of Immigrants from Norway and percentage of population with at least 5th grade education in the United States with a correlation coefficient (R) of 0.394 and weighted average of 97.6%. Similarly, the statistical analysis conducted on geographies consisting of 132,592,860 people shows a weak positive correlation between the proportion of Macedonians and percentage of population with at least 5th grade education in the United States with a correlation coefficient (R) of 0.231 and weighted average of 97.9%, a difference of 0.24%.
5th Grade Correlation Summary
| Measurement | Immigrants from Norway | Macedonian |
| Minimum | 97.0% | 96.3% |
| Maximum | 100.0% | 100.0% |
| Range | 3.0% | 3.7% |
| Mean | 99.1% | 98.5% |
| Median | 99.4% | 98.5% |
| Interquartile 25% (IQ1) | 98.5% | 97.8% |
| Interquartile 75% (IQ3) | 100.0% | 99.2% |
| Interquartile Range (IQR) | 1.5% | 1.4% |
| Standard Deviation (Sample) | 0.93% | 0.99% |
| Standard Deviation (Population) | 0.91% | 0.98% |
Similar Demographics by 5th Grade
Demographics Similar to Immigrants from Norway by 5th Grade
In terms of 5th grade, the demographic groups most similar to Immigrants from Norway are Immigrants from France (97.6%, a difference of 0.0%), Immigrants from Japan (97.6%, a difference of 0.0%), Basque (97.6%, a difference of 0.010%), Syrian (97.6%, a difference of 0.010%), and Immigrants from Zimbabwe (97.6%, a difference of 0.010%).
| Demographics | Rating | Rank | 5th Grade |
| Immigrants | Croatia | 95.5 /100 | #116 | Exceptional 97.6% |
| Immigrants | Saudi Arabia | 95.4 /100 | #117 | Exceptional 97.6% |
| Basques | 95.2 /100 | #118 | Exceptional 97.6% |
| Syrians | 95.1 /100 | #119 | Exceptional 97.6% |
| Immigrants | Zimbabwe | 94.9 /100 | #120 | Exceptional 97.6% |
| Immigrants | France | 94.8 /100 | #121 | Exceptional 97.6% |
| Immigrants | Japan | 94.7 /100 | #122 | Exceptional 97.6% |
| Immigrants | Norway | 94.6 /100 | #123 | Exceptional 97.6% |
| Spanish | 93.7 /100 | #124 | Exceptional 97.6% |
| Immigrants | Bulgaria | 93.1 /100 | #125 | Exceptional 97.6% |
| Hmong | 92.3 /100 | #126 | Exceptional 97.6% |
| Immigrants | Serbia | 92.3 /100 | #127 | Exceptional 97.6% |
| Colville | 92.0 /100 | #128 | Exceptional 97.6% |
| Immigrants | Europe | 91.9 /100 | #129 | Exceptional 97.6% |
| Immigrants | Romania | 91.6 /100 | #130 | Exceptional 97.6% |
Demographics Similar to Macedonians by 5th Grade
In terms of 5th grade, the demographic groups most similar to Macedonians are Iranian (97.9%, a difference of 0.010%), Chickasaw (97.9%, a difference of 0.010%), Cherokee (97.8%, a difference of 0.010%), Kiowa (97.9%, a difference of 0.020%), and Lumbee (97.8%, a difference of 0.020%).
| Demographics | Rating | Rank | 5th Grade |
| Canadians | 99.6 /100 | #65 | Exceptional 97.9% |
| Immigrants | Austria | 99.6 /100 | #66 | Exceptional 97.9% |
| New Zealanders | 99.6 /100 | #67 | Exceptional 97.9% |
| Cajuns | 99.6 /100 | #68 | Exceptional 97.9% |
| Kiowa | 99.5 /100 | #69 | Exceptional 97.9% |
| Iranians | 99.5 /100 | #70 | Exceptional 97.9% |
| Chickasaw | 99.5 /100 | #71 | Exceptional 97.9% |
| Macedonians | 99.4 /100 | #72 | Exceptional 97.9% |
| Cherokee | 99.4 /100 | #73 | Exceptional 97.8% |
| Lumbee | 99.3 /100 | #74 | Exceptional 97.8% |
| Ukrainians | 99.3 /100 | #75 | Exceptional 97.8% |
| Immigrants | Netherlands | 99.3 /100 | #76 | Exceptional 97.8% |
| Immigrants | England | 99.3 /100 | #77 | Exceptional 97.8% |
| Osage | 99.3 /100 | #78 | Exceptional 97.8% |
| Immigrants | Lithuania | 99.2 /100 | #79 | Exceptional 97.8% |