Immigrants from Dominica vs Ugandan 5th Grade
COMPARE
Immigrants from Dominica
Ugandan
5th Grade
5th Grade Comparison
Immigrants from Dominica
Ugandans
96.2%
5TH GRADE
0.0/ 100
METRIC RATING
298th/ 347
METRIC RANK
97.4%
5TH GRADE
58.9/ 100
METRIC RATING
163rd/ 347
METRIC RANK
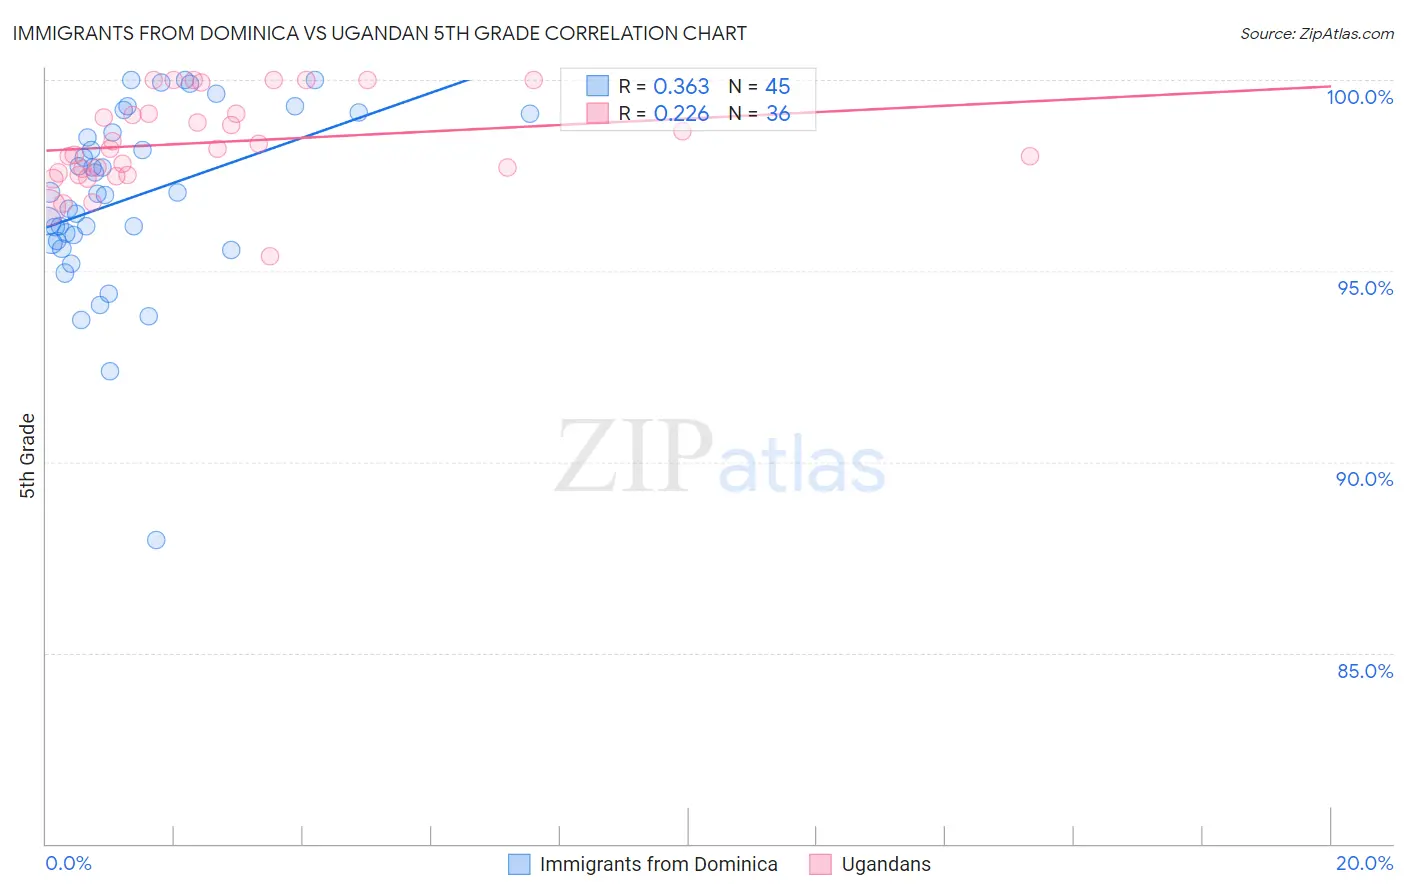
Immigrants from Dominica vs Ugandan 5th Grade Correlation Chart
The statistical analysis conducted on geographies consisting of 83,794,115 people shows a mild positive correlation between the proportion of Immigrants from Dominica and percentage of population with at least 5th grade education in the United States with a correlation coefficient (R) of 0.363 and weighted average of 96.2%. Similarly, the statistical analysis conducted on geographies consisting of 93,991,892 people shows a weak positive correlation between the proportion of Ugandans and percentage of population with at least 5th grade education in the United States with a correlation coefficient (R) of 0.226 and weighted average of 97.4%, a difference of 1.2%.
5th Grade Correlation Summary
| Measurement | Immigrants from Dominica | Ugandan |
| Minimum | 88.0% | 95.4% |
| Maximum | 100.0% | 100.0% |
| Range | 12.0% | 4.6% |
| Mean | 96.9% | 98.4% |
| Median | 97.0% | 98.2% |
| Interquartile 25% (IQ1) | 95.8% | 97.5% |
| Interquartile 75% (IQ3) | 98.9% | 99.1% |
| Interquartile Range (IQR) | 3.1% | 1.6% |
| Standard Deviation (Sample) | 2.4% | 1.2% |
| Standard Deviation (Population) | 2.3% | 1.1% |
Similar Demographics by 5th Grade
Demographics Similar to Immigrants from Dominica by 5th Grade
In terms of 5th grade, the demographic groups most similar to Immigrants from Dominica are Immigrants (96.2%, a difference of 0.030%), Haitian (96.3%, a difference of 0.050%), Immigrants from South Eastern Asia (96.3%, a difference of 0.080%), Sri Lankan (96.1%, a difference of 0.080%), and Immigrants from Cuba (96.1%, a difference of 0.10%).
| Demographics | Rating | Rank | 5th Grade |
| Malaysians | 0.0 /100 | #291 | Tragic 96.5% |
| Somalis | 0.0 /100 | #292 | Tragic 96.5% |
| Immigrants | Grenada | 0.0 /100 | #293 | Tragic 96.5% |
| Immigrants | Eritrea | 0.0 /100 | #294 | Tragic 96.4% |
| Immigrants | Somalia | 0.0 /100 | #295 | Tragic 96.4% |
| Immigrants | South Eastern Asia | 0.0 /100 | #296 | Tragic 96.3% |
| Haitians | 0.0 /100 | #297 | Tragic 96.3% |
| Immigrants | Dominica | 0.0 /100 | #298 | Tragic 96.2% |
| Immigrants | Immigrants | 0.0 /100 | #299 | Tragic 96.2% |
| Sri Lankans | 0.0 /100 | #300 | Tragic 96.1% |
| Immigrants | Cuba | 0.0 /100 | #301 | Tragic 96.1% |
| Guyanese | 0.0 /100 | #302 | Tragic 96.1% |
| Puerto Ricans | 0.0 /100 | #303 | Tragic 96.1% |
| Immigrants | Burma/Myanmar | 0.0 /100 | #304 | Tragic 96.1% |
| Immigrants | Laos | 0.0 /100 | #305 | Tragic 96.0% |
Demographics Similar to Ugandans by 5th Grade
In terms of 5th grade, the demographic groups most similar to Ugandans are Kenyan (97.4%, a difference of 0.0%), Immigrants from Iran (97.4%, a difference of 0.0%), Bermudan (97.4%, a difference of 0.0%), Immigrants from Poland (97.4%, a difference of 0.0%), and Marshallese (97.4%, a difference of 0.010%).
| Demographics | Rating | Rank | 5th Grade |
| French American Indians | 70.5 /100 | #156 | Good 97.4% |
| Immigrants | Jordan | 70.4 /100 | #157 | Good 97.4% |
| Albanians | 68.3 /100 | #158 | Good 97.4% |
| Immigrants | Italy | 65.2 /100 | #159 | Good 97.4% |
| Marshallese | 61.2 /100 | #160 | Good 97.4% |
| Kenyans | 59.7 /100 | #161 | Average 97.4% |
| Immigrants | Iran | 59.5 /100 | #162 | Average 97.4% |
| Ugandans | 58.9 /100 | #163 | Average 97.4% |
| Bermudans | 58.8 /100 | #164 | Average 97.4% |
| Immigrants | Poland | 57.9 /100 | #165 | Average 97.4% |
| Apache | 57.2 /100 | #166 | Average 97.4% |
| Immigrants | Belarus | 54.6 /100 | #167 | Average 97.3% |
| Chileans | 54.5 /100 | #168 | Average 97.3% |
| Immigrants | Korea | 54.1 /100 | #169 | Average 97.3% |
| Venezuelans | 54.0 /100 | #170 | Average 97.3% |