Immigrants from Bahamas vs Ugandan 5th Grade
COMPARE
Immigrants from Bahamas
Ugandan
5th Grade
5th Grade Comparison
Immigrants from Bahamas
Ugandans
97.2%
5TH GRADE
14.9/ 100
METRIC RATING
203rd/ 347
METRIC RANK
97.4%
5TH GRADE
58.9/ 100
METRIC RATING
163rd/ 347
METRIC RANK
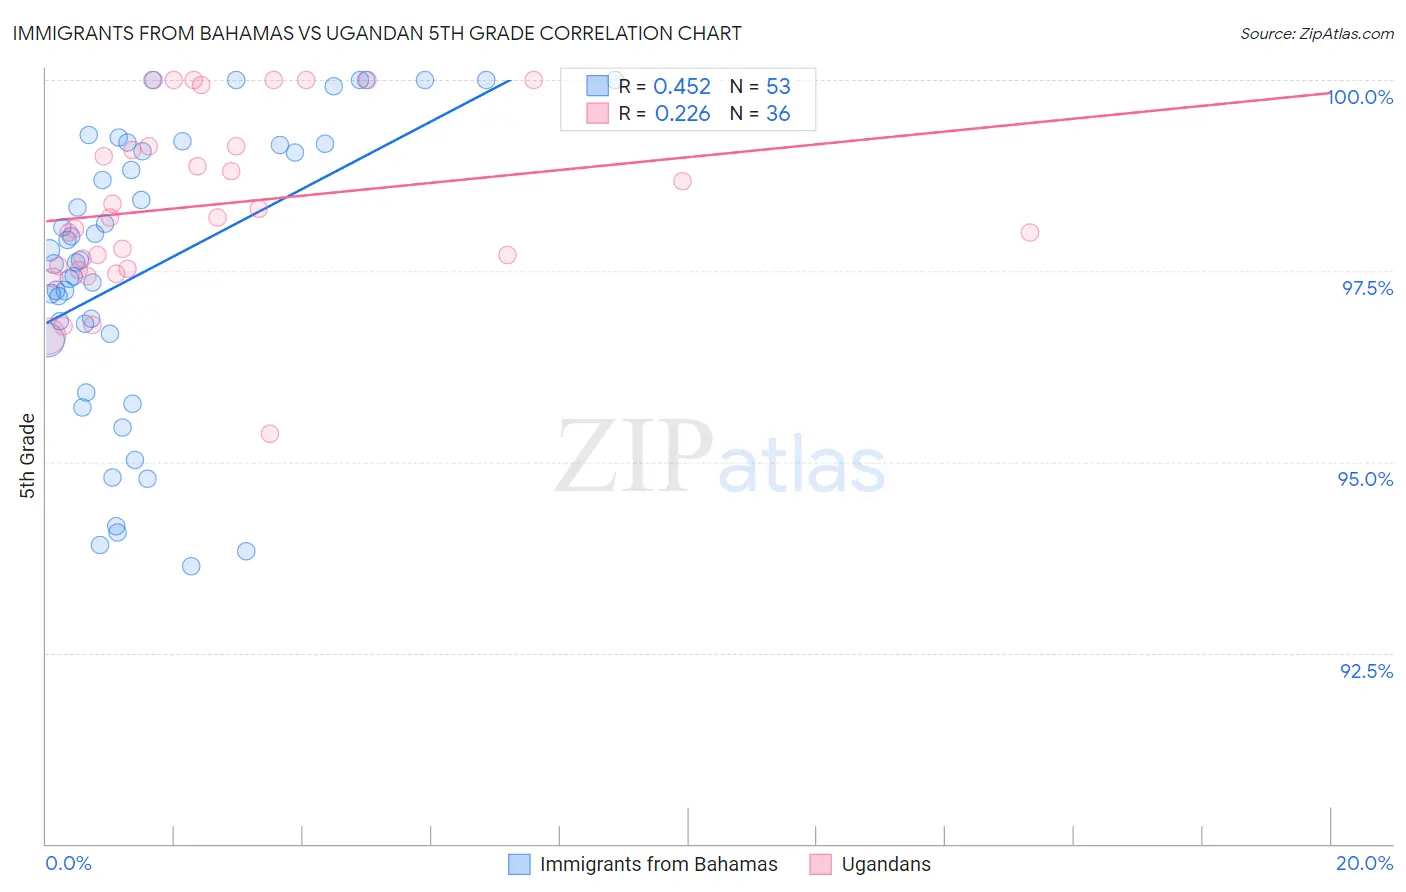
Immigrants from Bahamas vs Ugandan 5th Grade Correlation Chart
The statistical analysis conducted on geographies consisting of 104,665,087 people shows a moderate positive correlation between the proportion of Immigrants from Bahamas and percentage of population with at least 5th grade education in the United States with a correlation coefficient (R) of 0.452 and weighted average of 97.2%. Similarly, the statistical analysis conducted on geographies consisting of 93,991,892 people shows a weak positive correlation between the proportion of Ugandans and percentage of population with at least 5th grade education in the United States with a correlation coefficient (R) of 0.226 and weighted average of 97.4%, a difference of 0.22%.
5th Grade Correlation Summary
| Measurement | Immigrants from Bahamas | Ugandan |
| Minimum | 93.6% | 95.4% |
| Maximum | 100.0% | 100.0% |
| Range | 6.4% | 4.6% |
| Mean | 97.5% | 98.4% |
| Median | 97.7% | 98.2% |
| Interquartile 25% (IQ1) | 96.6% | 97.5% |
| Interquartile 75% (IQ3) | 99.2% | 99.1% |
| Interquartile Range (IQR) | 2.5% | 1.6% |
| Standard Deviation (Sample) | 1.9% | 1.2% |
| Standard Deviation (Population) | 1.8% | 1.1% |
Similar Demographics by 5th Grade
Demographics Similar to Immigrants from Bahamas by 5th Grade
In terms of 5th grade, the demographic groups most similar to Immigrants from Bahamas are African (97.2%, a difference of 0.0%), Immigrants from Northern Africa (97.2%, a difference of 0.010%), Immigrants from Chile (97.2%, a difference of 0.010%), Immigrants from Zaire (97.1%, a difference of 0.010%), and Native/Alaskan (97.2%, a difference of 0.020%).
| Demographics | Rating | Rank | 5th Grade |
| Hawaiians | 25.6 /100 | #196 | Fair 97.2% |
| Brazilians | 25.4 /100 | #197 | Fair 97.2% |
| Immigrants | Uganda | 21.1 /100 | #198 | Fair 97.2% |
| Natives/Alaskans | 18.0 /100 | #199 | Poor 97.2% |
| Immigrants | Northern Africa | 16.8 /100 | #200 | Poor 97.2% |
| Immigrants | Chile | 16.6 /100 | #201 | Poor 97.2% |
| Africans | 15.3 /100 | #202 | Poor 97.2% |
| Immigrants | Bahamas | 14.9 /100 | #203 | Poor 97.2% |
| Immigrants | Zaire | 13.7 /100 | #204 | Poor 97.1% |
| Moroccans | 12.0 /100 | #205 | Poor 97.1% |
| Paiute | 11.6 /100 | #206 | Poor 97.1% |
| Iraqis | 10.9 /100 | #207 | Poor 97.1% |
| Laotians | 10.8 /100 | #208 | Poor 97.1% |
| Immigrants | Nepal | 10.3 /100 | #209 | Poor 97.1% |
| Immigrants | Oceania | 10.0 /100 | #210 | Poor 97.1% |
Demographics Similar to Ugandans by 5th Grade
In terms of 5th grade, the demographic groups most similar to Ugandans are Kenyan (97.4%, a difference of 0.0%), Immigrants from Iran (97.4%, a difference of 0.0%), Bermudan (97.4%, a difference of 0.0%), Immigrants from Poland (97.4%, a difference of 0.0%), and Marshallese (97.4%, a difference of 0.010%).
| Demographics | Rating | Rank | 5th Grade |
| French American Indians | 70.5 /100 | #156 | Good 97.4% |
| Immigrants | Jordan | 70.4 /100 | #157 | Good 97.4% |
| Albanians | 68.3 /100 | #158 | Good 97.4% |
| Immigrants | Italy | 65.2 /100 | #159 | Good 97.4% |
| Marshallese | 61.2 /100 | #160 | Good 97.4% |
| Kenyans | 59.7 /100 | #161 | Average 97.4% |
| Immigrants | Iran | 59.5 /100 | #162 | Average 97.4% |
| Ugandans | 58.9 /100 | #163 | Average 97.4% |
| Bermudans | 58.8 /100 | #164 | Average 97.4% |
| Immigrants | Poland | 57.9 /100 | #165 | Average 97.4% |
| Apache | 57.2 /100 | #166 | Average 97.4% |
| Immigrants | Belarus | 54.6 /100 | #167 | Average 97.3% |
| Chileans | 54.5 /100 | #168 | Average 97.3% |
| Immigrants | Korea | 54.1 /100 | #169 | Average 97.3% |
| Venezuelans | 54.0 /100 | #170 | Average 97.3% |