Immigrants from Norway vs Pennsylvania German Master's Degree
COMPARE
Immigrants from Norway
Pennsylvania German
Master's Degree
Master's Degree Comparison
Immigrants from Norway
Pennsylvania Germans
18.8%
MASTER'S DEGREE
100.0/ 100
METRIC RATING
46th/ 347
METRIC RANK
10.7%
MASTER'S DEGREE
0.0/ 100
METRIC RATING
321st/ 347
METRIC RANK
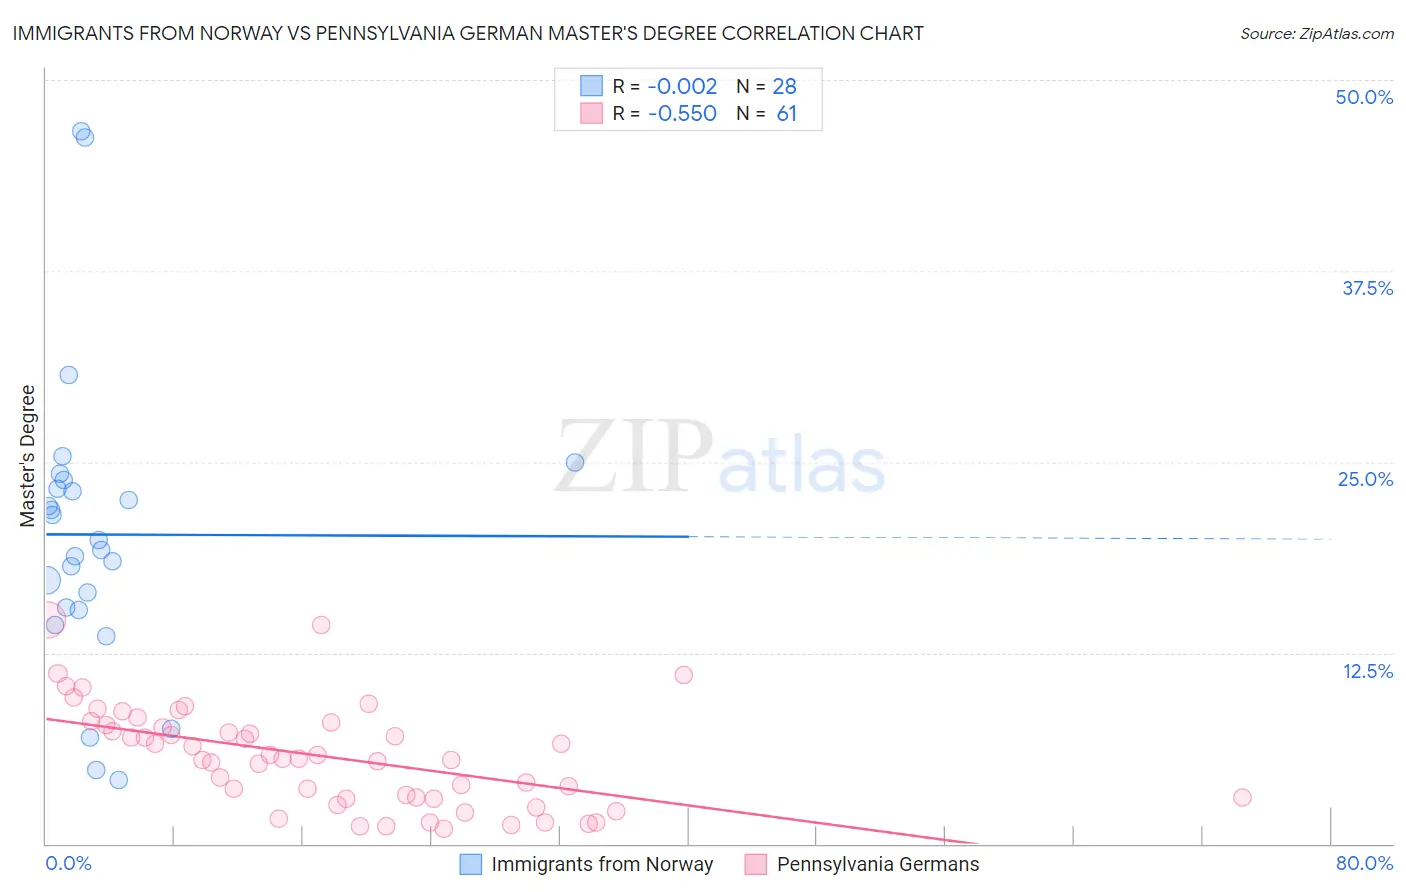
Immigrants from Norway vs Pennsylvania German Master's Degree Correlation Chart
The statistical analysis conducted on geographies consisting of 116,700,664 people shows no correlation between the proportion of Immigrants from Norway and percentage of population with at least master's degree education in the United States with a correlation coefficient (R) of -0.002 and weighted average of 18.8%. Similarly, the statistical analysis conducted on geographies consisting of 234,030,574 people shows a substantial negative correlation between the proportion of Pennsylvania Germans and percentage of population with at least master's degree education in the United States with a correlation coefficient (R) of -0.550 and weighted average of 10.7%, a difference of 75.2%.
Master's Degree Correlation Summary
| Measurement | Immigrants from Norway | Pennsylvania German |
| Minimum | 4.2% | 1.0% |
| Maximum | 46.7% | 14.6% |
| Range | 42.5% | 13.6% |
| Mean | 20.2% | 5.7% |
| Median | 19.6% | 5.6% |
| Interquartile 25% (IQ1) | 15.4% | 3.0% |
| Interquartile 75% (IQ3) | 23.5% | 7.9% |
| Interquartile Range (IQR) | 8.1% | 4.9% |
| Standard Deviation (Sample) | 9.8% | 3.3% |
| Standard Deviation (Population) | 9.6% | 3.2% |
Similar Demographics by Master's Degree
Demographics Similar to Immigrants from Norway by Master's Degree
In terms of master's degree, the demographic groups most similar to Immigrants from Norway are Immigrants from Austria (18.8%, a difference of 0.010%), Paraguayan (18.8%, a difference of 0.070%), Estonian (18.8%, a difference of 0.17%), Bulgarian (18.8%, a difference of 0.35%), and Immigrants from South Africa (18.8%, a difference of 0.37%).
| Demographics | Rating | Rank | Master's Degree |
| Immigrants | Spain | 100.0 /100 | #39 | Exceptional 19.1% |
| Immigrants | Bolivia | 100.0 /100 | #40 | Exceptional 19.1% |
| Immigrants | Latvia | 100.0 /100 | #41 | Exceptional 19.1% |
| Immigrants | Saudi Arabia | 100.0 /100 | #42 | Exceptional 19.0% |
| Immigrants | Greece | 100.0 /100 | #43 | Exceptional 19.0% |
| Immigrants | Malaysia | 100.0 /100 | #44 | Exceptional 18.9% |
| Immigrants | Belarus | 100.0 /100 | #45 | Exceptional 18.9% |
| Immigrants | Norway | 100.0 /100 | #46 | Exceptional 18.8% |
| Immigrants | Austria | 100.0 /100 | #47 | Exceptional 18.8% |
| Paraguayans | 100.0 /100 | #48 | Exceptional 18.8% |
| Estonians | 100.0 /100 | #49 | Exceptional 18.8% |
| Bulgarians | 100.0 /100 | #50 | Exceptional 18.8% |
| Immigrants | South Africa | 100.0 /100 | #51 | Exceptional 18.8% |
| Immigrants | Kuwait | 100.0 /100 | #52 | Exceptional 18.6% |
| Immigrants | Czechoslovakia | 99.9 /100 | #53 | Exceptional 18.5% |
Demographics Similar to Pennsylvania Germans by Master's Degree
In terms of master's degree, the demographic groups most similar to Pennsylvania Germans are Immigrants from Micronesia (10.8%, a difference of 0.21%), Sioux (10.7%, a difference of 0.64%), Kiowa (10.8%, a difference of 0.83%), Crow (10.6%, a difference of 1.0%), and Immigrants from Cuba (10.9%, a difference of 1.1%).
| Demographics | Rating | Rank | Master's Degree |
| Cajuns | 0.0 /100 | #314 | Tragic 11.0% |
| Apache | 0.0 /100 | #315 | Tragic 11.0% |
| Hispanics or Latinos | 0.0 /100 | #316 | Tragic 10.9% |
| Hopi | 0.0 /100 | #317 | Tragic 10.9% |
| Immigrants | Cuba | 0.0 /100 | #318 | Tragic 10.9% |
| Kiowa | 0.0 /100 | #319 | Tragic 10.8% |
| Immigrants | Micronesia | 0.0 /100 | #320 | Tragic 10.8% |
| Pennsylvania Germans | 0.0 /100 | #321 | Tragic 10.7% |
| Sioux | 0.0 /100 | #322 | Tragic 10.7% |
| Crow | 0.0 /100 | #323 | Tragic 10.6% |
| Dutch West Indians | 0.0 /100 | #324 | Tragic 10.6% |
| Inupiat | 0.0 /100 | #325 | Tragic 10.5% |
| Creek | 0.0 /100 | #326 | Tragic 10.5% |
| Paiute | 0.0 /100 | #327 | Tragic 10.5% |
| Bangladeshis | 0.0 /100 | #328 | Tragic 10.5% |