Immigrants from Northern Europe vs Indonesian 3rd Grade
COMPARE
Immigrants from Northern Europe
Indonesian
3rd Grade
3rd Grade Comparison
Immigrants from Northern Europe
Indonesians
98.2%
3RD GRADE
99.6/ 100
METRIC RATING
68th/ 347
METRIC RANK
96.5%
3RD GRADE
0.0/ 100
METRIC RATING
321st/ 347
METRIC RANK
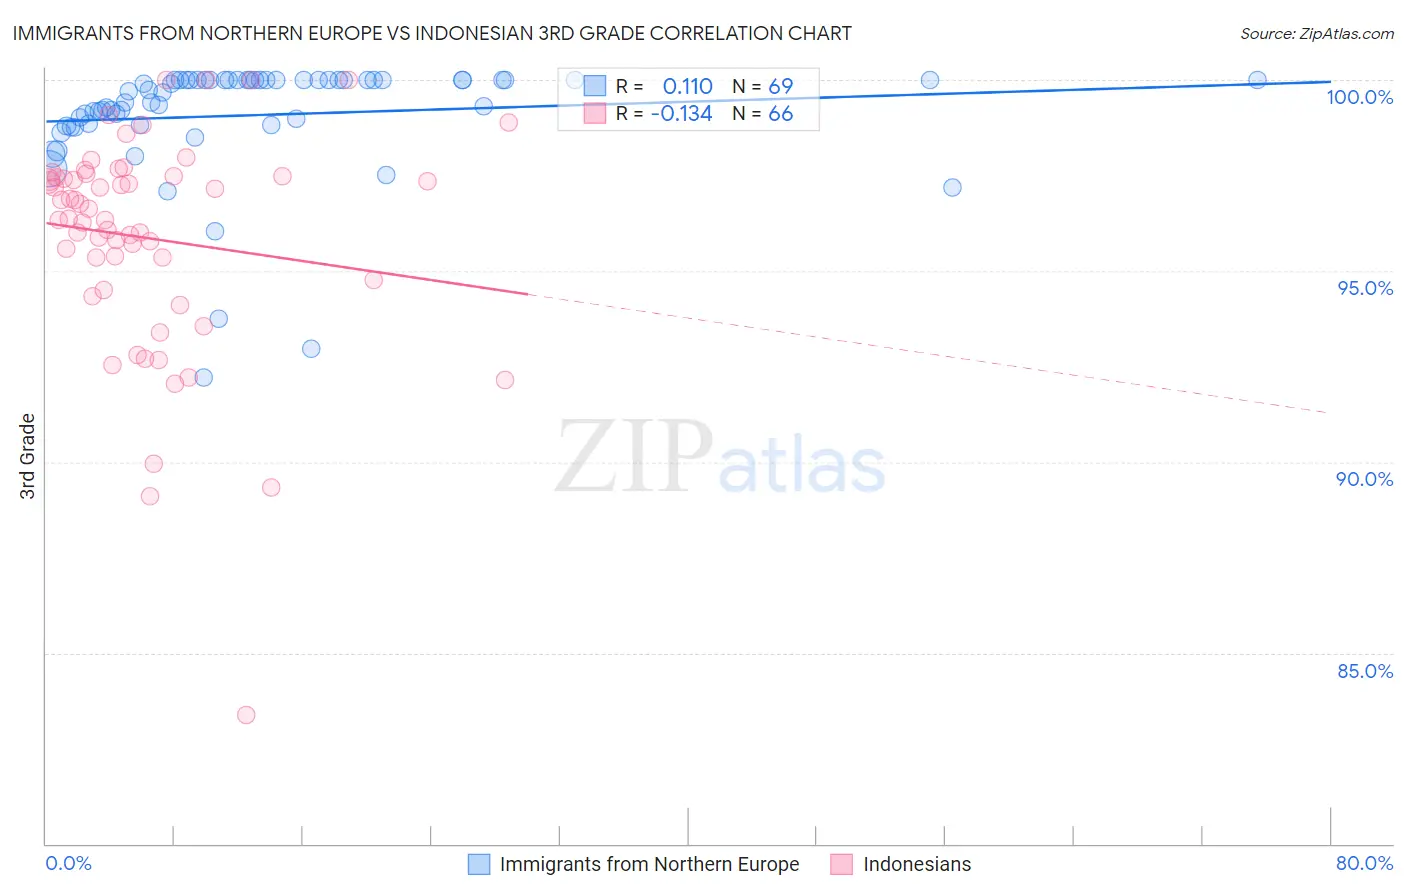
Immigrants from Northern Europe vs Indonesian 3rd Grade Correlation Chart
The statistical analysis conducted on geographies consisting of 477,226,800 people shows a poor positive correlation between the proportion of Immigrants from Northern Europe and percentage of population with at least 3rd grade education in the United States with a correlation coefficient (R) of 0.110 and weighted average of 98.2%. Similarly, the statistical analysis conducted on geographies consisting of 162,727,113 people shows a poor negative correlation between the proportion of Indonesians and percentage of population with at least 3rd grade education in the United States with a correlation coefficient (R) of -0.134 and weighted average of 96.5%, a difference of 1.8%.
3rd Grade Correlation Summary
| Measurement | Immigrants from Northern Europe | Indonesian |
| Minimum | 92.2% | 83.4% |
| Maximum | 100.0% | 100.0% |
| Range | 7.8% | 16.6% |
| Mean | 99.1% | 95.9% |
| Median | 99.7% | 96.5% |
| Interquartile 25% (IQ1) | 98.8% | 94.8% |
| Interquartile 75% (IQ3) | 100.0% | 97.5% |
| Interquartile Range (IQR) | 1.2% | 2.7% |
| Standard Deviation (Sample) | 1.6% | 2.9% |
| Standard Deviation (Population) | 1.6% | 2.9% |
Similar Demographics by 3rd Grade
Demographics Similar to Immigrants from Northern Europe by 3rd Grade
In terms of 3rd grade, the demographic groups most similar to Immigrants from Northern Europe are New Zealander (98.2%, a difference of 0.0%), Serbian (98.2%, a difference of 0.0%), Russian (98.2%, a difference of 0.0%), Canadian (98.2%, a difference of 0.0%), and Cajun (98.2%, a difference of 0.0%).
| Demographics | Rating | Rank | 3rd Grade |
| Pueblo | 99.7 /100 | #61 | Exceptional 98.2% |
| Immigrants | Canada | 99.7 /100 | #62 | Exceptional 98.2% |
| Immigrants | North America | 99.7 /100 | #63 | Exceptional 98.2% |
| Kiowa | 99.6 /100 | #64 | Exceptional 98.2% |
| New Zealanders | 99.6 /100 | #65 | Exceptional 98.2% |
| Serbians | 99.6 /100 | #66 | Exceptional 98.2% |
| Russians | 99.6 /100 | #67 | Exceptional 98.2% |
| Immigrants | Northern Europe | 99.6 /100 | #68 | Exceptional 98.2% |
| Canadians | 99.6 /100 | #69 | Exceptional 98.2% |
| Cajuns | 99.6 /100 | #70 | Exceptional 98.2% |
| Immigrants | Austria | 99.6 /100 | #71 | Exceptional 98.2% |
| Chickasaw | 99.5 /100 | #72 | Exceptional 98.2% |
| Cheyenne | 99.3 /100 | #73 | Exceptional 98.2% |
| Immigrants | Netherlands | 99.3 /100 | #74 | Exceptional 98.2% |
| Cherokee | 99.3 /100 | #75 | Exceptional 98.2% |
Demographics Similar to Indonesians by 3rd Grade
In terms of 3rd grade, the demographic groups most similar to Indonesians are Immigrants from Nicaragua (96.5%, a difference of 0.0%), Immigrants from Belize (96.5%, a difference of 0.0%), Vietnamese (96.5%, a difference of 0.010%), Honduran (96.5%, a difference of 0.020%), and Hispanic or Latino (96.5%, a difference of 0.030%).
| Demographics | Rating | Rank | 3rd Grade |
| Belizeans | 0.0 /100 | #314 | Tragic 96.6% |
| Immigrants | Azores | 0.0 /100 | #315 | Tragic 96.6% |
| Immigrants | Burma/Myanmar | 0.0 /100 | #316 | Tragic 96.6% |
| Immigrants | Bangladesh | 0.0 /100 | #317 | Tragic 96.6% |
| Hispanics or Latinos | 0.0 /100 | #318 | Tragic 96.5% |
| Vietnamese | 0.0 /100 | #319 | Tragic 96.5% |
| Immigrants | Nicaragua | 0.0 /100 | #320 | Tragic 96.5% |
| Indonesians | 0.0 /100 | #321 | Tragic 96.5% |
| Immigrants | Belize | 0.0 /100 | #322 | Tragic 96.5% |
| Hondurans | 0.0 /100 | #323 | Tragic 96.5% |
| Dominicans | 0.0 /100 | #324 | Tragic 96.4% |
| Mexican American Indians | 0.0 /100 | #325 | Tragic 96.4% |
| Immigrants | Vietnam | 0.0 /100 | #326 | Tragic 96.4% |
| Japanese | 0.0 /100 | #327 | Tragic 96.4% |
| Bangladeshis | 0.0 /100 | #328 | Tragic 96.3% |