Immigrants from Northern Africa vs Immigrants from Africa 9th Grade
COMPARE
Immigrants from Northern Africa
Immigrants from Africa
9th Grade
9th Grade Comparison
Immigrants from Northern Africa
Immigrants from Africa
94.7%
9TH GRADE
30.7/ 100
METRIC RATING
192nd/ 347
METRIC RANK
94.3%
9TH GRADE
3.9/ 100
METRIC RATING
232nd/ 347
METRIC RANK
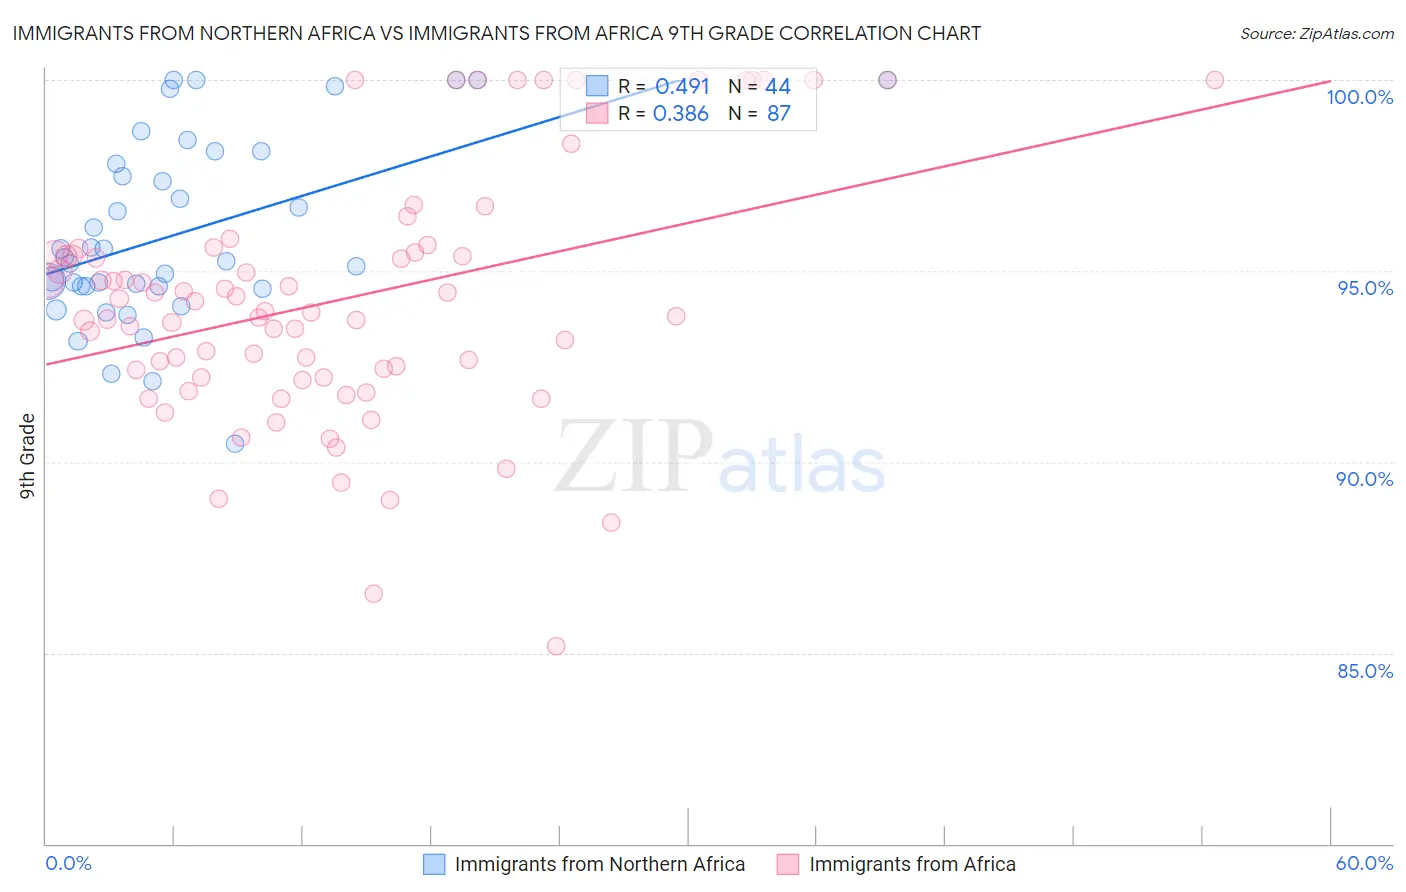
Immigrants from Northern Africa vs Immigrants from Africa 9th Grade Correlation Chart
The statistical analysis conducted on geographies consisting of 321,196,768 people shows a moderate positive correlation between the proportion of Immigrants from Northern Africa and percentage of population with at least 9th grade education in the United States with a correlation coefficient (R) of 0.491 and weighted average of 94.7%. Similarly, the statistical analysis conducted on geographies consisting of 469,381,733 people shows a mild positive correlation between the proportion of Immigrants from Africa and percentage of population with at least 9th grade education in the United States with a correlation coefficient (R) of 0.386 and weighted average of 94.3%, a difference of 0.44%.
9th Grade Correlation Summary
| Measurement | Immigrants from Northern Africa | Immigrants from Africa |
| Minimum | 90.5% | 85.2% |
| Maximum | 100.0% | 100.0% |
| Range | 9.5% | 14.8% |
| Mean | 96.0% | 94.2% |
| Median | 95.3% | 93.9% |
| Interquartile 25% (IQ1) | 94.6% | 92.2% |
| Interquartile 75% (IQ3) | 98.0% | 95.5% |
| Interquartile Range (IQR) | 3.4% | 3.3% |
| Standard Deviation (Sample) | 2.4% | 3.2% |
| Standard Deviation (Population) | 2.4% | 3.2% |
Similar Demographics by 9th Grade
Demographics Similar to Immigrants from Northern Africa by 9th Grade
In terms of 9th grade, the demographic groups most similar to Immigrants from Northern Africa are Assyrian/Chaldean/Syriac (94.7%, a difference of 0.010%), Paraguayan (94.7%, a difference of 0.010%), Panamanian (94.7%, a difference of 0.010%), Sudanese (94.7%, a difference of 0.020%), and Marshallese (94.7%, a difference of 0.020%).
| Demographics | Rating | Rank | 9th Grade |
| Liberians | 37.4 /100 | #185 | Fair 94.8% |
| Hopi | 37.1 /100 | #186 | Fair 94.8% |
| Guamanians/Chamorros | 35.5 /100 | #187 | Fair 94.8% |
| Immigrants | Albania | 34.5 /100 | #188 | Fair 94.8% |
| Immigrants | Argentina | 34.4 /100 | #189 | Fair 94.8% |
| Sudanese | 32.7 /100 | #190 | Fair 94.7% |
| Assyrians/Chaldeans/Syriacs | 32.0 /100 | #191 | Fair 94.7% |
| Immigrants | Northern Africa | 30.7 /100 | #192 | Fair 94.7% |
| Paraguayans | 30.1 /100 | #193 | Fair 94.7% |
| Panamanians | 29.0 /100 | #194 | Fair 94.7% |
| Marshallese | 27.9 /100 | #195 | Fair 94.7% |
| Immigrants | Lebanon | 27.2 /100 | #196 | Fair 94.7% |
| Immigrants | Micronesia | 24.7 /100 | #197 | Fair 94.7% |
| Hawaiians | 22.7 /100 | #198 | Fair 94.7% |
| Laotians | 21.0 /100 | #199 | Fair 94.6% |
Demographics Similar to Immigrants from Africa by 9th Grade
In terms of 9th grade, the demographic groups most similar to Immigrants from Africa are Apache (94.3%, a difference of 0.010%), Immigrants from Panama (94.3%, a difference of 0.010%), Nigerian (94.3%, a difference of 0.010%), Costa Rican (94.3%, a difference of 0.020%), and Immigrants from Southern Europe (94.3%, a difference of 0.030%).
| Demographics | Rating | Rank | 9th Grade |
| Ethiopians | 5.4 /100 | #225 | Tragic 94.4% |
| Sub-Saharan Africans | 5.4 /100 | #226 | Tragic 94.4% |
| Immigrants | Sierra Leone | 4.8 /100 | #227 | Tragic 94.4% |
| Lumbee | 4.7 /100 | #228 | Tragic 94.4% |
| Immigrants | Southern Europe | 4.5 /100 | #229 | Tragic 94.3% |
| Apache | 4.2 /100 | #230 | Tragic 94.3% |
| Immigrants | Panama | 4.0 /100 | #231 | Tragic 94.3% |
| Immigrants | Africa | 3.9 /100 | #232 | Tragic 94.3% |
| Nigerians | 3.7 /100 | #233 | Tragic 94.3% |
| Costa Ricans | 3.5 /100 | #234 | Tragic 94.3% |
| Bolivians | 3.3 /100 | #235 | Tragic 94.3% |
| Somalis | 2.9 /100 | #236 | Tragic 94.3% |
| Koreans | 2.9 /100 | #237 | Tragic 94.3% |
| South American Indians | 2.8 /100 | #238 | Tragic 94.3% |
| Immigrants | China | 2.8 /100 | #239 | Tragic 94.3% |