Immigrants from Northern Africa vs Spaniard 9th Grade
COMPARE
Immigrants from Northern Africa
Spaniard
9th Grade
9th Grade Comparison
Immigrants from Northern Africa
Spaniards
94.7%
9TH GRADE
30.7/ 100
METRIC RATING
192nd/ 347
METRIC RANK
94.9%
9TH GRADE
59.6/ 100
METRIC RATING
169th/ 347
METRIC RANK
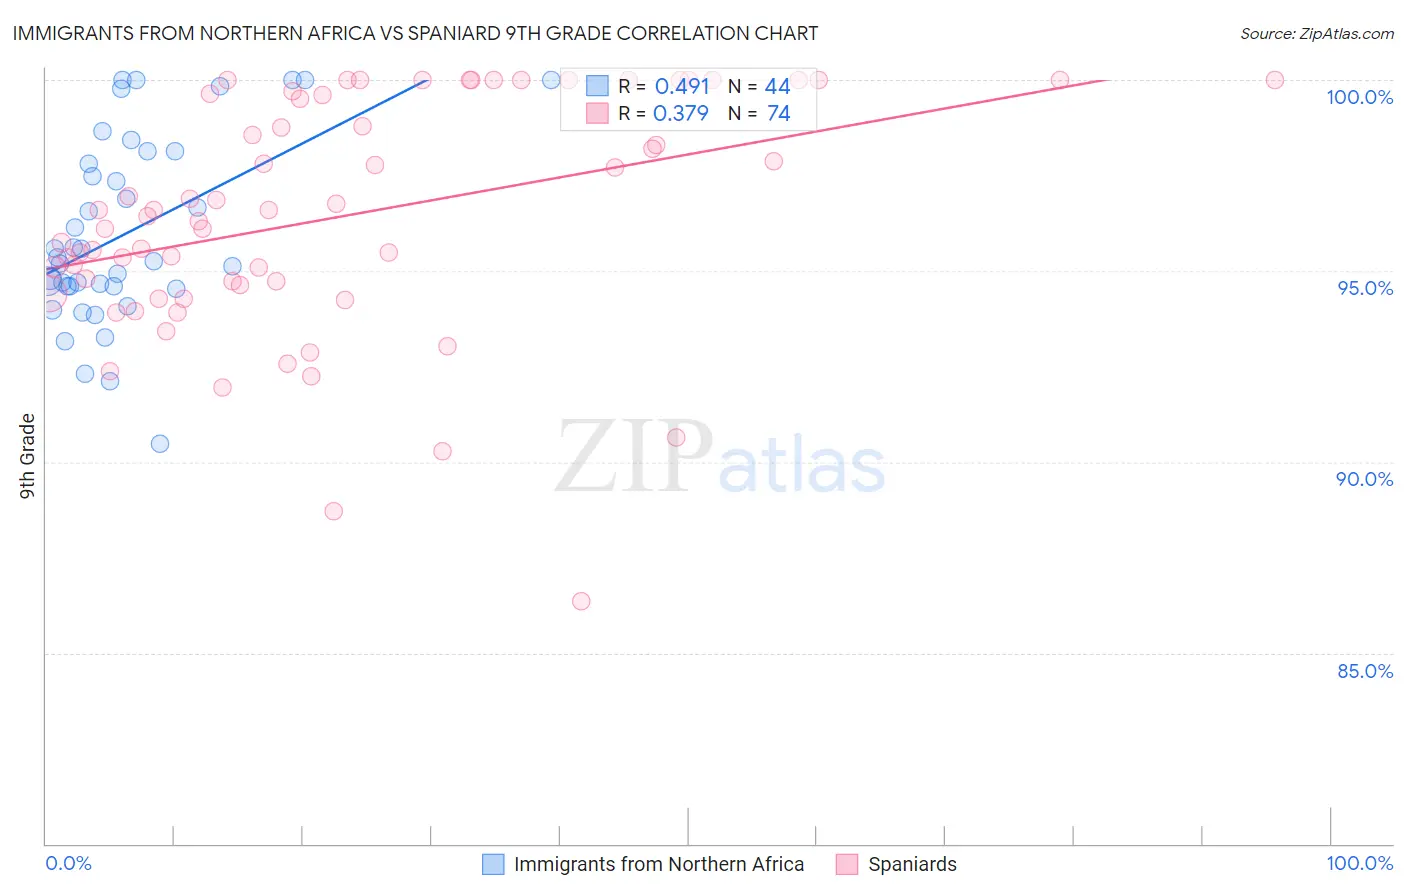
Immigrants from Northern Africa vs Spaniard 9th Grade Correlation Chart
The statistical analysis conducted on geographies consisting of 321,196,768 people shows a moderate positive correlation between the proportion of Immigrants from Northern Africa and percentage of population with at least 9th grade education in the United States with a correlation coefficient (R) of 0.491 and weighted average of 94.7%. Similarly, the statistical analysis conducted on geographies consisting of 443,543,963 people shows a mild positive correlation between the proportion of Spaniards and percentage of population with at least 9th grade education in the United States with a correlation coefficient (R) of 0.379 and weighted average of 94.9%, a difference of 0.22%.
9th Grade Correlation Summary
| Measurement | Immigrants from Northern Africa | Spaniard |
| Minimum | 90.5% | 86.4% |
| Maximum | 100.0% | 100.0% |
| Range | 9.5% | 13.6% |
| Mean | 96.0% | 96.4% |
| Median | 95.3% | 96.5% |
| Interquartile 25% (IQ1) | 94.6% | 94.6% |
| Interquartile 75% (IQ3) | 98.0% | 99.6% |
| Interquartile Range (IQR) | 3.4% | 5.0% |
| Standard Deviation (Sample) | 2.4% | 3.1% |
| Standard Deviation (Population) | 2.4% | 3.0% |
Similar Demographics by 9th Grade
Demographics Similar to Immigrants from Northern Africa by 9th Grade
In terms of 9th grade, the demographic groups most similar to Immigrants from Northern Africa are Assyrian/Chaldean/Syriac (94.7%, a difference of 0.010%), Paraguayan (94.7%, a difference of 0.010%), Panamanian (94.7%, a difference of 0.010%), Sudanese (94.7%, a difference of 0.020%), and Marshallese (94.7%, a difference of 0.020%).
| Demographics | Rating | Rank | 9th Grade |
| Liberians | 37.4 /100 | #185 | Fair 94.8% |
| Hopi | 37.1 /100 | #186 | Fair 94.8% |
| Guamanians/Chamorros | 35.5 /100 | #187 | Fair 94.8% |
| Immigrants | Albania | 34.5 /100 | #188 | Fair 94.8% |
| Immigrants | Argentina | 34.4 /100 | #189 | Fair 94.8% |
| Sudanese | 32.7 /100 | #190 | Fair 94.7% |
| Assyrians/Chaldeans/Syriacs | 32.0 /100 | #191 | Fair 94.7% |
| Immigrants | Northern Africa | 30.7 /100 | #192 | Fair 94.7% |
| Paraguayans | 30.1 /100 | #193 | Fair 94.7% |
| Panamanians | 29.0 /100 | #194 | Fair 94.7% |
| Marshallese | 27.9 /100 | #195 | Fair 94.7% |
| Immigrants | Lebanon | 27.2 /100 | #196 | Fair 94.7% |
| Immigrants | Micronesia | 24.7 /100 | #197 | Fair 94.7% |
| Hawaiians | 22.7 /100 | #198 | Fair 94.7% |
| Laotians | 21.0 /100 | #199 | Fair 94.6% |
Demographics Similar to Spaniards by 9th Grade
In terms of 9th grade, the demographic groups most similar to Spaniards are Immigrants from Brazil (95.0%, a difference of 0.010%), Chilean (95.0%, a difference of 0.010%), Alsatian (94.9%, a difference of 0.010%), Colville (94.9%, a difference of 0.010%), and Blackfeet (95.0%, a difference of 0.020%).
| Demographics | Rating | Rank | 9th Grade |
| Bermudans | 65.8 /100 | #162 | Good 95.0% |
| Pakistanis | 64.1 /100 | #163 | Good 95.0% |
| Venezuelans | 63.6 /100 | #164 | Good 95.0% |
| Blackfeet | 62.6 /100 | #165 | Good 95.0% |
| Ute | 62.6 /100 | #166 | Good 95.0% |
| Immigrants | Brazil | 61.1 /100 | #167 | Good 95.0% |
| Chileans | 60.7 /100 | #168 | Good 95.0% |
| Spaniards | 59.6 /100 | #169 | Average 94.9% |
| Alsatians | 58.6 /100 | #170 | Average 94.9% |
| Colville | 58.5 /100 | #171 | Average 94.9% |
| Iraqis | 54.0 /100 | #172 | Average 94.9% |
| Cheyenne | 51.5 /100 | #173 | Average 94.9% |
| Immigrants | Egypt | 50.0 /100 | #174 | Average 94.9% |
| Brazilians | 49.8 /100 | #175 | Average 94.9% |
| Immigrants | Spain | 49.1 /100 | #176 | Average 94.9% |