Immigrants from Northern Africa vs Immigrants from Bangladesh GED/Equivalency
COMPARE
Immigrants from Northern Africa
Immigrants from Bangladesh
GED/Equivalency
GED/Equivalency Comparison
Immigrants from Northern Africa
Immigrants from Bangladesh
86.3%
GED/EQUIVALENCY
79.3/ 100
METRIC RATING
147th/ 347
METRIC RANK
81.9%
GED/EQUIVALENCY
0.0/ 100
METRIC RATING
297th/ 347
METRIC RANK
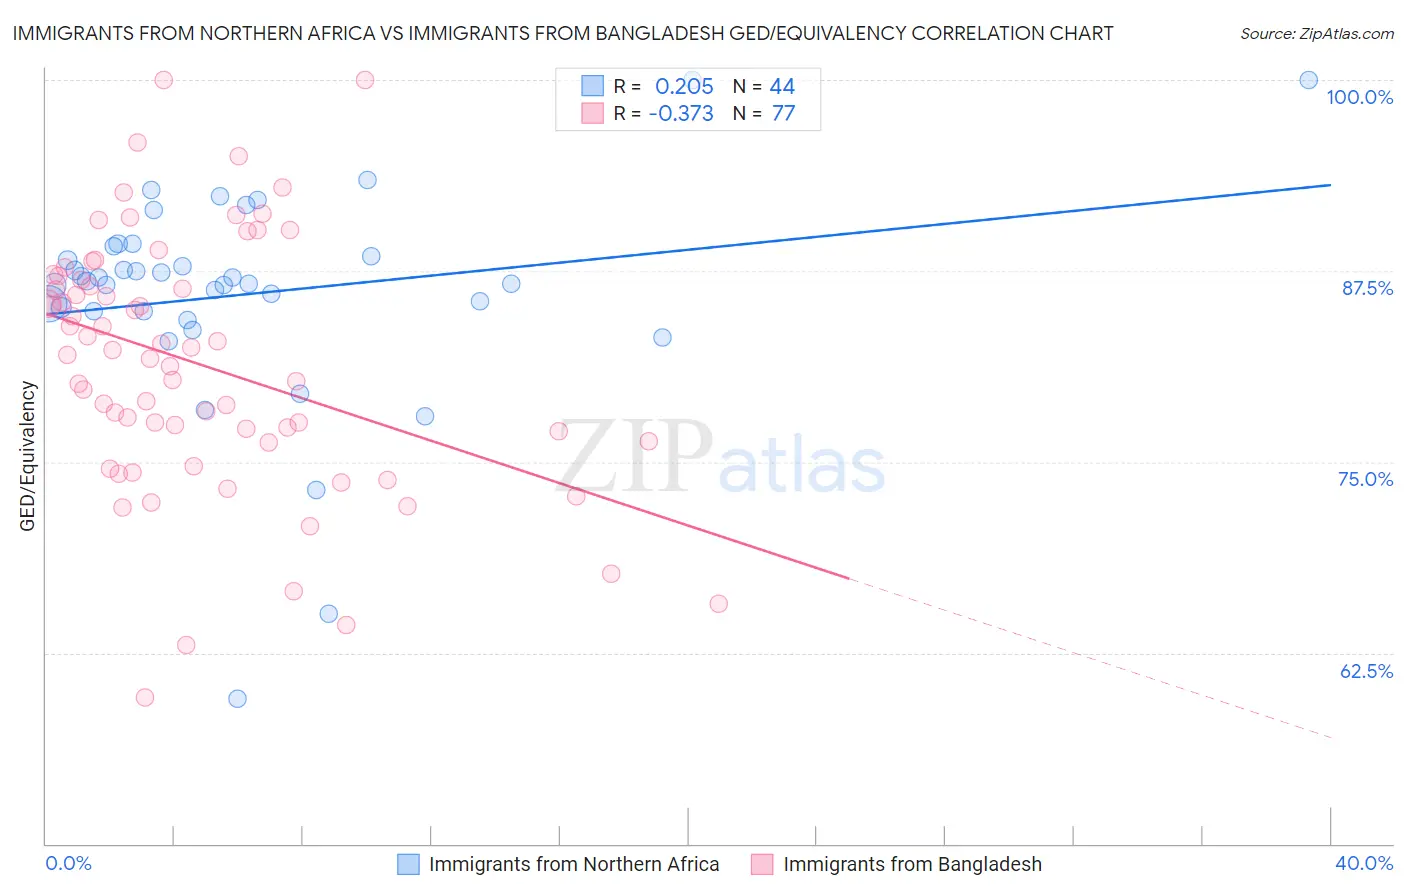
Immigrants from Northern Africa vs Immigrants from Bangladesh GED/Equivalency Correlation Chart
The statistical analysis conducted on geographies consisting of 321,196,768 people shows a weak positive correlation between the proportion of Immigrants from Northern Africa and percentage of population with at least ged/equivalency education in the United States with a correlation coefficient (R) of 0.205 and weighted average of 86.3%. Similarly, the statistical analysis conducted on geographies consisting of 203,682,679 people shows a mild negative correlation between the proportion of Immigrants from Bangladesh and percentage of population with at least ged/equivalency education in the United States with a correlation coefficient (R) of -0.373 and weighted average of 81.9%, a difference of 5.4%.
GED/Equivalency Correlation Summary
| Measurement | Immigrants from Northern Africa | Immigrants from Bangladesh |
| Minimum | 59.5% | 59.6% |
| Maximum | 100.0% | 100.0% |
| Range | 40.5% | 40.4% |
| Mean | 86.0% | 81.4% |
| Median | 86.7% | 82.0% |
| Interquartile 25% (IQ1) | 84.9% | 76.3% |
| Interquartile 75% (IQ3) | 88.8% | 87.0% |
| Interquartile Range (IQR) | 3.9% | 10.7% |
| Standard Deviation (Sample) | 7.1% | 8.3% |
| Standard Deviation (Population) | 7.1% | 8.3% |
Similar Demographics by GED/Equivalency
Demographics Similar to Immigrants from Northern Africa by GED/Equivalency
In terms of ged/equivalency, the demographic groups most similar to Immigrants from Northern Africa are Basque (86.4%, a difference of 0.0%), Immigrants from Poland (86.3%, a difference of 0.0%), Menominee (86.3%, a difference of 0.0%), Immigrants from Western Asia (86.3%, a difference of 0.020%), and Pakistani (86.4%, a difference of 0.030%).
| Demographics | Rating | Rank | GED/Equivalency |
| Paraguayans | 84.1 /100 | #140 | Excellent 86.5% |
| Laotians | 83.2 /100 | #141 | Excellent 86.5% |
| Immigrants | Indonesia | 82.4 /100 | #142 | Excellent 86.4% |
| Immigrants | Pakistan | 82.4 /100 | #143 | Excellent 86.4% |
| Bolivians | 82.1 /100 | #144 | Excellent 86.4% |
| Pakistanis | 80.4 /100 | #145 | Excellent 86.4% |
| Basques | 79.5 /100 | #146 | Good 86.4% |
| Immigrants | Northern Africa | 79.3 /100 | #147 | Good 86.3% |
| Immigrants | Poland | 79.3 /100 | #148 | Good 86.3% |
| Menominee | 79.3 /100 | #149 | Good 86.3% |
| Immigrants | Western Asia | 78.8 /100 | #150 | Good 86.3% |
| Immigrants | Bosnia and Herzegovina | 77.9 /100 | #151 | Good 86.3% |
| Brazilians | 77.2 /100 | #152 | Good 86.3% |
| Kenyans | 76.6 /100 | #153 | Good 86.3% |
| Armenians | 76.4 /100 | #154 | Good 86.3% |
Demographics Similar to Immigrants from Bangladesh by GED/Equivalency
In terms of ged/equivalency, the demographic groups most similar to Immigrants from Bangladesh are Vietnamese (81.9%, a difference of 0.040%), Nepalese (81.9%, a difference of 0.070%), Ute (81.8%, a difference of 0.090%), Immigrants from St. Vincent and the Grenadines (82.0%, a difference of 0.13%), and Paiute (82.0%, a difference of 0.16%).
| Demographics | Rating | Rank | GED/Equivalency |
| Haitians | 0.0 /100 | #290 | Tragic 82.1% |
| Cubans | 0.0 /100 | #291 | Tragic 82.0% |
| Paiute | 0.0 /100 | #292 | Tragic 82.0% |
| British West Indians | 0.0 /100 | #293 | Tragic 82.0% |
| Immigrants | St. Vincent and the Grenadines | 0.0 /100 | #294 | Tragic 82.0% |
| Nepalese | 0.0 /100 | #295 | Tragic 81.9% |
| Vietnamese | 0.0 /100 | #296 | Tragic 81.9% |
| Immigrants | Bangladesh | 0.0 /100 | #297 | Tragic 81.9% |
| Ute | 0.0 /100 | #298 | Tragic 81.8% |
| Ecuadorians | 0.0 /100 | #299 | Tragic 81.7% |
| Fijians | 0.0 /100 | #300 | Tragic 81.6% |
| Dutch West Indians | 0.0 /100 | #301 | Tragic 81.6% |
| Immigrants | Haiti | 0.0 /100 | #302 | Tragic 81.6% |
| Immigrants | Portugal | 0.0 /100 | #303 | Tragic 81.6% |
| Navajo | 0.0 /100 | #304 | Tragic 81.5% |