Immigrants from Uruguay vs Immigrants from Bangladesh GED/Equivalency
COMPARE
Immigrants from Uruguay
Immigrants from Bangladesh
GED/Equivalency
GED/Equivalency Comparison
Immigrants from Uruguay
Immigrants from Bangladesh
84.4%
GED/EQUIVALENCY
4.6/ 100
METRIC RATING
229th/ 347
METRIC RANK
81.9%
GED/EQUIVALENCY
0.0/ 100
METRIC RATING
297th/ 347
METRIC RANK
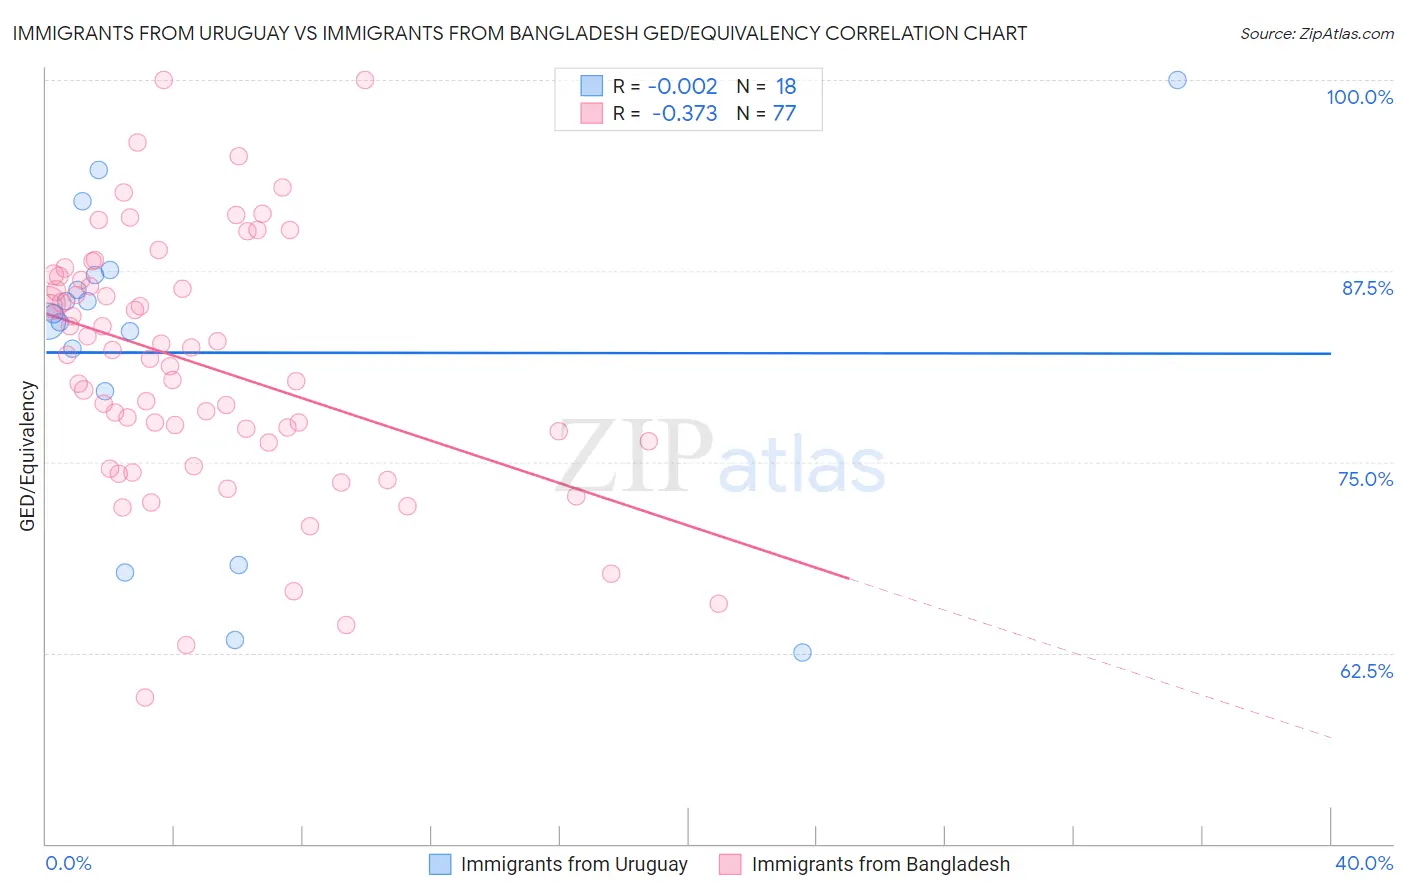
Immigrants from Uruguay vs Immigrants from Bangladesh GED/Equivalency Correlation Chart
The statistical analysis conducted on geographies consisting of 133,259,667 people shows no correlation between the proportion of Immigrants from Uruguay and percentage of population with at least ged/equivalency education in the United States with a correlation coefficient (R) of -0.002 and weighted average of 84.4%. Similarly, the statistical analysis conducted on geographies consisting of 203,682,679 people shows a mild negative correlation between the proportion of Immigrants from Bangladesh and percentage of population with at least ged/equivalency education in the United States with a correlation coefficient (R) of -0.373 and weighted average of 81.9%, a difference of 3.1%.
GED/Equivalency Correlation Summary
| Measurement | Immigrants from Uruguay | Immigrants from Bangladesh |
| Minimum | 62.5% | 59.6% |
| Maximum | 100.0% | 100.0% |
| Range | 37.5% | 40.4% |
| Mean | 82.2% | 81.4% |
| Median | 84.4% | 82.0% |
| Interquartile 25% (IQ1) | 79.7% | 76.3% |
| Interquartile 75% (IQ3) | 87.2% | 87.0% |
| Interquartile Range (IQR) | 7.6% | 10.7% |
| Standard Deviation (Sample) | 10.3% | 8.3% |
| Standard Deviation (Population) | 10.0% | 8.3% |
Similar Demographics by GED/Equivalency
Demographics Similar to Immigrants from Uruguay by GED/Equivalency
In terms of ged/equivalency, the demographic groups most similar to Immigrants from Uruguay are Immigrants from Colombia (84.4%, a difference of 0.010%), Immigrants from Liberia (84.4%, a difference of 0.030%), Immigrants from Middle Africa (84.4%, a difference of 0.030%), Immigrants from South America (84.4%, a difference of 0.050%), and Immigrants from Panama (84.4%, a difference of 0.060%).
| Demographics | Rating | Rank | GED/Equivalency |
| Iroquois | 7.5 /100 | #222 | Tragic 84.6% |
| Immigrants | Uzbekistan | 7.1 /100 | #223 | Tragic 84.6% |
| French American Indians | 6.3 /100 | #224 | Tragic 84.6% |
| Immigrants | Thailand | 5.8 /100 | #225 | Tragic 84.5% |
| Immigrants | Zaire | 5.5 /100 | #226 | Tragic 84.5% |
| Immigrants | Costa Rica | 5.4 /100 | #227 | Tragic 84.5% |
| Immigrants | Liberia | 4.9 /100 | #228 | Tragic 84.4% |
| Immigrants | Uruguay | 4.6 /100 | #229 | Tragic 84.4% |
| Immigrants | Colombia | 4.5 /100 | #230 | Tragic 84.4% |
| Immigrants | Middle Africa | 4.3 /100 | #231 | Tragic 84.4% |
| Immigrants | South America | 4.2 /100 | #232 | Tragic 84.4% |
| Immigrants | Panama | 4.1 /100 | #233 | Tragic 84.4% |
| Immigrants | Nigeria | 3.6 /100 | #234 | Tragic 84.3% |
| Ghanaians | 3.5 /100 | #235 | Tragic 84.3% |
| Immigrants | Eritrea | 3.5 /100 | #236 | Tragic 84.3% |
Demographics Similar to Immigrants from Bangladesh by GED/Equivalency
In terms of ged/equivalency, the demographic groups most similar to Immigrants from Bangladesh are Vietnamese (81.9%, a difference of 0.040%), Nepalese (81.9%, a difference of 0.070%), Ute (81.8%, a difference of 0.090%), Immigrants from St. Vincent and the Grenadines (82.0%, a difference of 0.13%), and Paiute (82.0%, a difference of 0.16%).
| Demographics | Rating | Rank | GED/Equivalency |
| Haitians | 0.0 /100 | #290 | Tragic 82.1% |
| Cubans | 0.0 /100 | #291 | Tragic 82.0% |
| Paiute | 0.0 /100 | #292 | Tragic 82.0% |
| British West Indians | 0.0 /100 | #293 | Tragic 82.0% |
| Immigrants | St. Vincent and the Grenadines | 0.0 /100 | #294 | Tragic 82.0% |
| Nepalese | 0.0 /100 | #295 | Tragic 81.9% |
| Vietnamese | 0.0 /100 | #296 | Tragic 81.9% |
| Immigrants | Bangladesh | 0.0 /100 | #297 | Tragic 81.9% |
| Ute | 0.0 /100 | #298 | Tragic 81.8% |
| Ecuadorians | 0.0 /100 | #299 | Tragic 81.7% |
| Fijians | 0.0 /100 | #300 | Tragic 81.6% |
| Dutch West Indians | 0.0 /100 | #301 | Tragic 81.6% |
| Immigrants | Haiti | 0.0 /100 | #302 | Tragic 81.6% |
| Immigrants | Portugal | 0.0 /100 | #303 | Tragic 81.6% |
| Navajo | 0.0 /100 | #304 | Tragic 81.5% |