Immigrants from Northern Africa vs Iraqi Professional Degree
COMPARE
Immigrants from Northern Africa
Iraqi
Professional Degree
Professional Degree Comparison
Immigrants from Northern Africa
Iraqis
5.1%
PROFESSIONAL DEGREE
98.4/ 100
METRIC RATING
103rd/ 347
METRIC RANK
4.5%
PROFESSIONAL DEGREE
69.8/ 100
METRIC RATING
157th/ 347
METRIC RANK
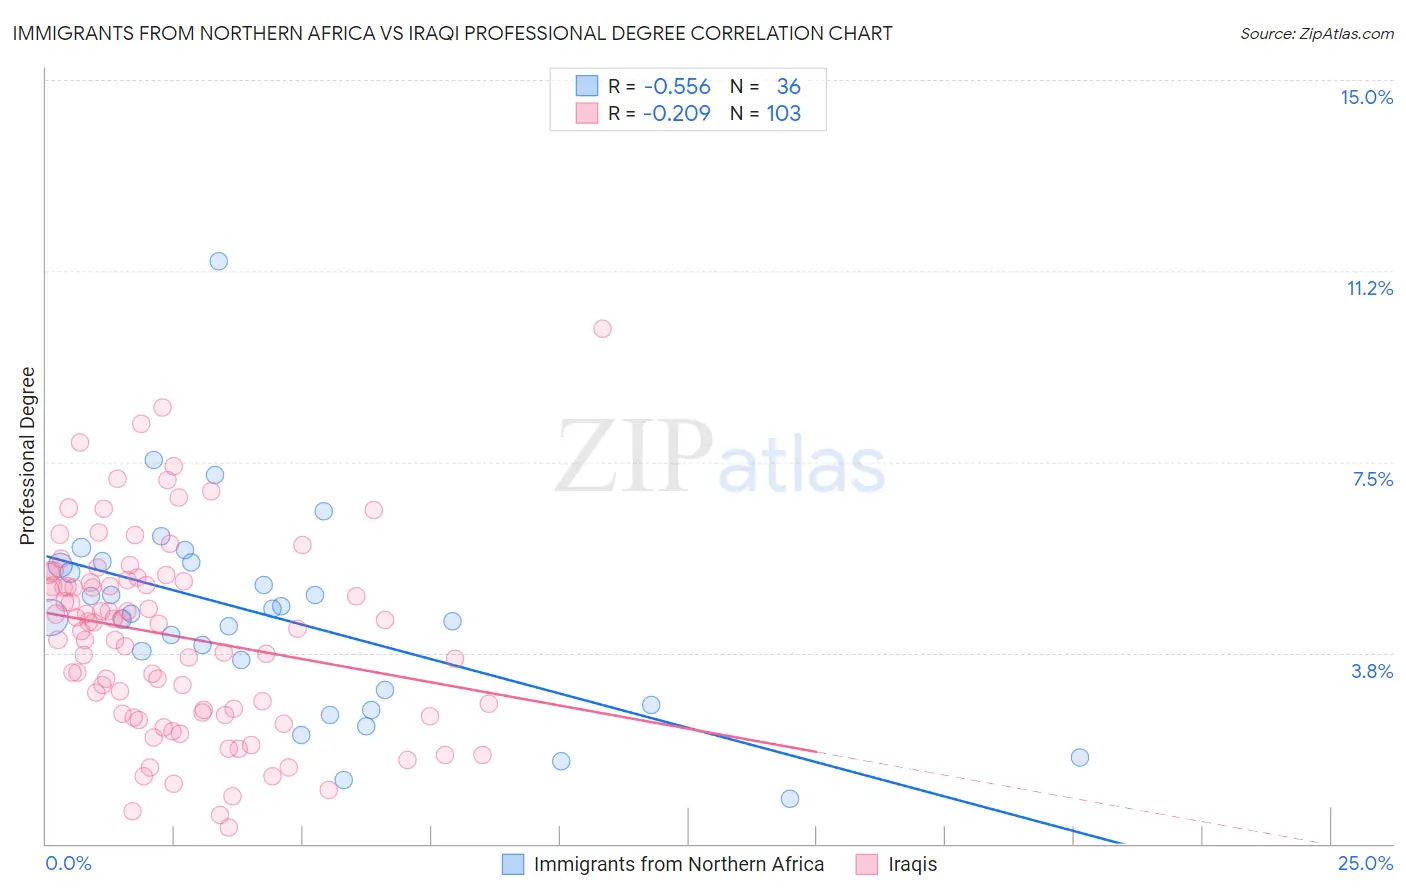
Immigrants from Northern Africa vs Iraqi Professional Degree Correlation Chart
The statistical analysis conducted on geographies consisting of 320,940,889 people shows a substantial negative correlation between the proportion of Immigrants from Northern Africa and percentage of population with at least professional degree education in the United States with a correlation coefficient (R) of -0.556 and weighted average of 5.1%. Similarly, the statistical analysis conducted on geographies consisting of 170,610,184 people shows a weak negative correlation between the proportion of Iraqis and percentage of population with at least professional degree education in the United States with a correlation coefficient (R) of -0.209 and weighted average of 4.5%, a difference of 11.5%.
Professional Degree Correlation Summary
| Measurement | Immigrants from Northern Africa | Iraqi |
| Minimum | 0.89% | 0.32% |
| Maximum | 11.4% | 10.1% |
| Range | 10.5% | 9.8% |
| Mean | 4.4% | 4.1% |
| Median | 4.5% | 4.3% |
| Interquartile 25% (IQ1) | 2.9% | 2.6% |
| Interquartile 75% (IQ3) | 5.5% | 5.2% |
| Interquartile Range (IQR) | 2.6% | 2.6% |
| Standard Deviation (Sample) | 2.0% | 1.9% |
| Standard Deviation (Population) | 2.0% | 1.9% |
Similar Demographics by Professional Degree
Demographics Similar to Immigrants from Northern Africa by Professional Degree
In terms of professional degree, the demographic groups most similar to Immigrants from Northern Africa are Ukrainian (5.1%, a difference of 0.25%), Arab (5.0%, a difference of 0.31%), Immigrants from Egypt (5.1%, a difference of 0.33%), Immigrants from Uganda (5.0%, a difference of 0.34%), and Immigrants from Ukraine (5.0%, a difference of 0.37%).
| Demographics | Rating | Rank | Professional Degree |
| Immigrants | Uzbekistan | 99.2 /100 | #96 | Exceptional 5.2% |
| Syrians | 99.1 /100 | #97 | Exceptional 5.2% |
| Austrians | 99.1 /100 | #98 | Exceptional 5.2% |
| Immigrants | Italy | 99.1 /100 | #99 | Exceptional 5.2% |
| Ugandans | 98.8 /100 | #100 | Exceptional 5.1% |
| Immigrants | Egypt | 98.5 /100 | #101 | Exceptional 5.1% |
| Ukrainians | 98.5 /100 | #102 | Exceptional 5.1% |
| Immigrants | Northern Africa | 98.4 /100 | #103 | Exceptional 5.1% |
| Arabs | 98.2 /100 | #104 | Exceptional 5.0% |
| Immigrants | Uganda | 98.2 /100 | #105 | Exceptional 5.0% |
| Immigrants | Ukraine | 98.2 /100 | #106 | Exceptional 5.0% |
| Maltese | 98.1 /100 | #107 | Exceptional 5.0% |
| Immigrants | Southern Europe | 98.1 /100 | #108 | Exceptional 5.0% |
| British | 98.0 /100 | #109 | Exceptional 5.0% |
| Lebanese | 98.0 /100 | #110 | Exceptional 5.0% |
Demographics Similar to Iraqis by Professional Degree
In terms of professional degree, the demographic groups most similar to Iraqis are Swedish (4.5%, a difference of 0.010%), Slavic (4.5%, a difference of 0.16%), Immigrants from Armenia (4.5%, a difference of 0.17%), Vietnamese (4.5%, a difference of 0.24%), and Immigrants from Senegal (4.5%, a difference of 0.30%).
| Demographics | Rating | Rank | Professional Degree |
| Immigrants | Oceania | 73.4 /100 | #150 | Good 4.6% |
| Poles | 72.6 /100 | #151 | Good 4.6% |
| Immigrants | Africa | 72.5 /100 | #152 | Good 4.6% |
| Immigrants | Uruguay | 72.5 /100 | #153 | Good 4.6% |
| Scottish | 71.8 /100 | #154 | Good 4.6% |
| Slavs | 70.8 /100 | #155 | Good 4.5% |
| Swedes | 69.9 /100 | #156 | Good 4.5% |
| Iraqis | 69.8 /100 | #157 | Good 4.5% |
| Immigrants | Armenia | 68.8 /100 | #158 | Good 4.5% |
| Vietnamese | 68.4 /100 | #159 | Good 4.5% |
| Immigrants | Senegal | 68.0 /100 | #160 | Good 4.5% |
| Assyrians/Chaldeans/Syriacs | 67.4 /100 | #161 | Good 4.5% |
| Peruvians | 65.2 /100 | #162 | Good 4.5% |
| Sierra Leoneans | 64.3 /100 | #163 | Good 4.5% |
| Swiss | 61.0 /100 | #164 | Good 4.5% |