Immigrants from Northern Africa vs Pima Associate's Degree
COMPARE
Immigrants from Northern Africa
Pima
Associate's Degree
Associate's Degree Comparison
Immigrants from Northern Africa
Pima
49.7%
ASSOCIATE'S DEGREE
97.9/ 100
METRIC RATING
98th/ 347
METRIC RANK
30.2%
ASSOCIATE'S DEGREE
0.0/ 100
METRIC RATING
345th/ 347
METRIC RANK
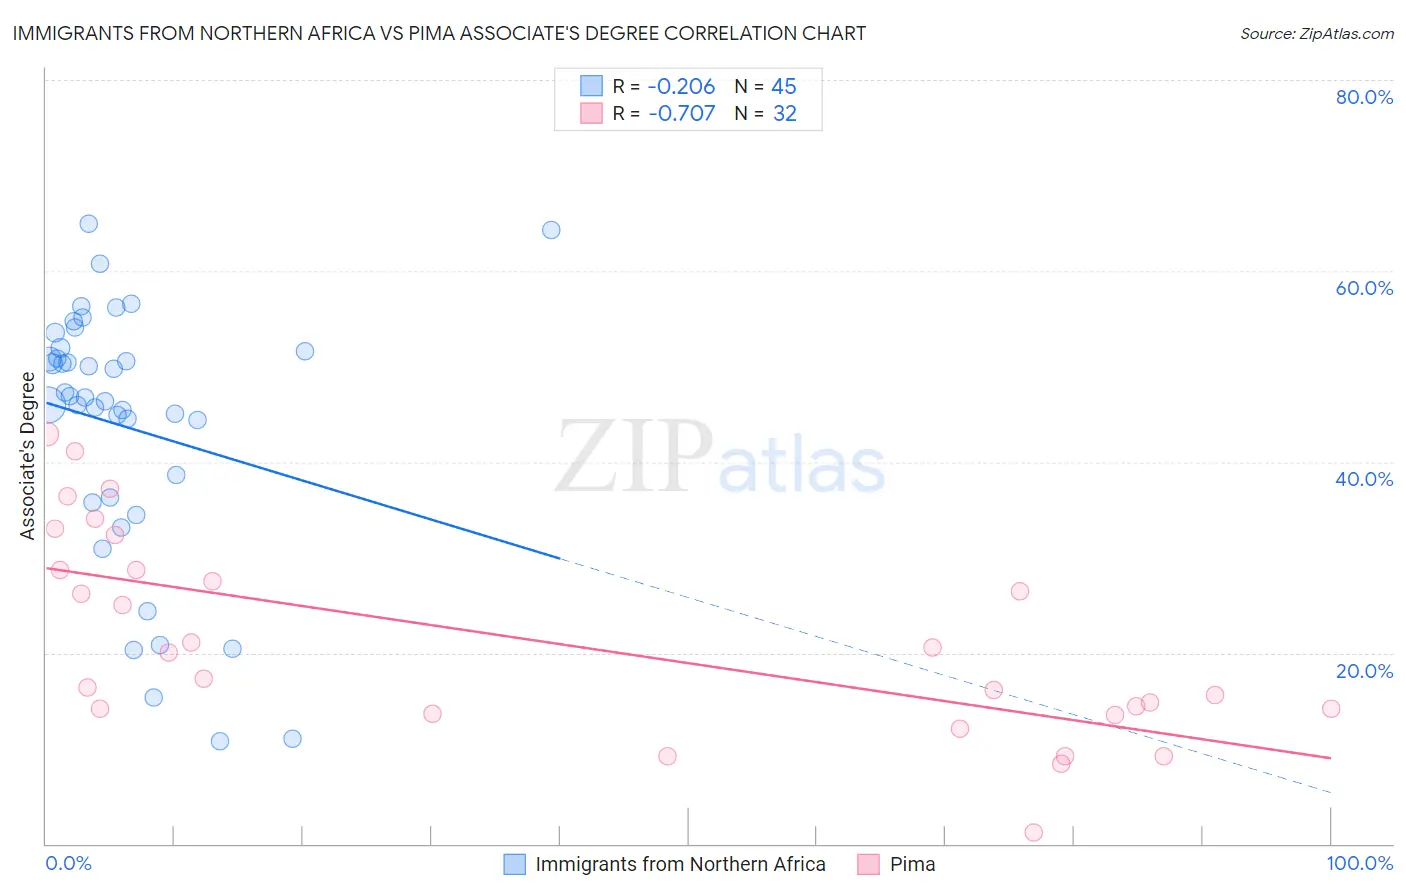
Immigrants from Northern Africa vs Pima Associate's Degree Correlation Chart
The statistical analysis conducted on geographies consisting of 321,197,052 people shows a weak negative correlation between the proportion of Immigrants from Northern Africa and percentage of population with at least associate's degree education in the United States with a correlation coefficient (R) of -0.206 and weighted average of 49.7%. Similarly, the statistical analysis conducted on geographies consisting of 61,552,411 people shows a strong negative correlation between the proportion of Pima and percentage of population with at least associate's degree education in the United States with a correlation coefficient (R) of -0.707 and weighted average of 30.2%, a difference of 64.4%.
Associate's Degree Correlation Summary
| Measurement | Immigrants from Northern Africa | Pima |
| Minimum | 10.8% | 1.2% |
| Maximum | 65.0% | 42.9% |
| Range | 54.2% | 41.8% |
| Mean | 43.6% | 21.3% |
| Median | 46.7% | 18.6% |
| Interquartile 25% (IQ1) | 36.0% | 13.8% |
| Interquartile 75% (IQ3) | 51.8% | 28.6% |
| Interquartile Range (IQR) | 15.8% | 14.8% |
| Standard Deviation (Sample) | 13.6% | 10.6% |
| Standard Deviation (Population) | 13.4% | 10.4% |
Similar Demographics by Associate's Degree
Demographics Similar to Immigrants from Northern Africa by Associate's Degree
In terms of associate's degree, the demographic groups most similar to Immigrants from Northern Africa are Macedonian (49.6%, a difference of 0.070%), Romanian (49.7%, a difference of 0.090%), Immigrants from Ukraine (49.7%, a difference of 0.090%), Immigrants from England (49.7%, a difference of 0.11%), and Immigrants from Nepal (49.5%, a difference of 0.28%).
| Demographics | Rating | Rank | Associate's Degree |
| Immigrants | Western Asia | 98.7 /100 | #91 | Exceptional 50.1% |
| Immigrants | North America | 98.7 /100 | #92 | Exceptional 50.1% |
| Immigrants | Brazil | 98.5 /100 | #93 | Exceptional 50.0% |
| Laotians | 98.4 /100 | #94 | Exceptional 49.9% |
| Immigrants | England | 98.0 /100 | #95 | Exceptional 49.7% |
| Romanians | 98.0 /100 | #96 | Exceptional 49.7% |
| Immigrants | Ukraine | 98.0 /100 | #97 | Exceptional 49.7% |
| Immigrants | Northern Africa | 97.9 /100 | #98 | Exceptional 49.7% |
| Macedonians | 97.8 /100 | #99 | Exceptional 49.6% |
| Immigrants | Nepal | 97.5 /100 | #100 | Exceptional 49.5% |
| Northern Europeans | 97.3 /100 | #101 | Exceptional 49.5% |
| Chileans | 97.3 /100 | #102 | Exceptional 49.4% |
| Ukrainians | 97.1 /100 | #103 | Exceptional 49.4% |
| Venezuelans | 97.0 /100 | #104 | Exceptional 49.4% |
| Croatians | 96.8 /100 | #105 | Exceptional 49.3% |
Demographics Similar to Pima by Associate's Degree
In terms of associate's degree, the demographic groups most similar to Pima are Yuman (31.3%, a difference of 3.4%), Tohono O'odham (31.8%, a difference of 5.1%), Yakama (32.3%, a difference of 6.9%), Houma (28.2%, a difference of 7.2%), and Inupiat (32.6%, a difference of 7.7%).
| Demographics | Rating | Rank | Associate's Degree |
| Mexicans | 0.0 /100 | #333 | Tragic 35.0% |
| Natives/Alaskans | 0.0 /100 | #334 | Tragic 34.9% |
| Spanish American Indians | 0.0 /100 | #335 | Tragic 34.9% |
| Hopi | 0.0 /100 | #336 | Tragic 34.6% |
| Lumbee | 0.0 /100 | #337 | Tragic 34.1% |
| Pueblo | 0.0 /100 | #338 | Tragic 34.0% |
| Immigrants | Mexico | 0.0 /100 | #339 | Tragic 33.7% |
| Navajo | 0.0 /100 | #340 | Tragic 32.6% |
| Inupiat | 0.0 /100 | #341 | Tragic 32.6% |
| Yakama | 0.0 /100 | #342 | Tragic 32.3% |
| Tohono O'odham | 0.0 /100 | #343 | Tragic 31.8% |
| Yuman | 0.0 /100 | #344 | Tragic 31.3% |
| Pima | 0.0 /100 | #345 | Tragic 30.2% |
| Houma | 0.0 /100 | #346 | Tragic 28.2% |
| Yup'ik | 0.0 /100 | #347 | Tragic 25.0% |