Immigrants from North Macedonia vs Nepalese 10th Grade
COMPARE
Immigrants from North Macedonia
Nepalese
10th Grade
10th Grade Comparison
Immigrants from North Macedonia
Nepalese
94.5%
10TH GRADE
97.2/ 100
METRIC RATING
108th/ 347
METRIC RANK
90.7%
10TH GRADE
0.0/ 100
METRIC RATING
314th/ 347
METRIC RANK
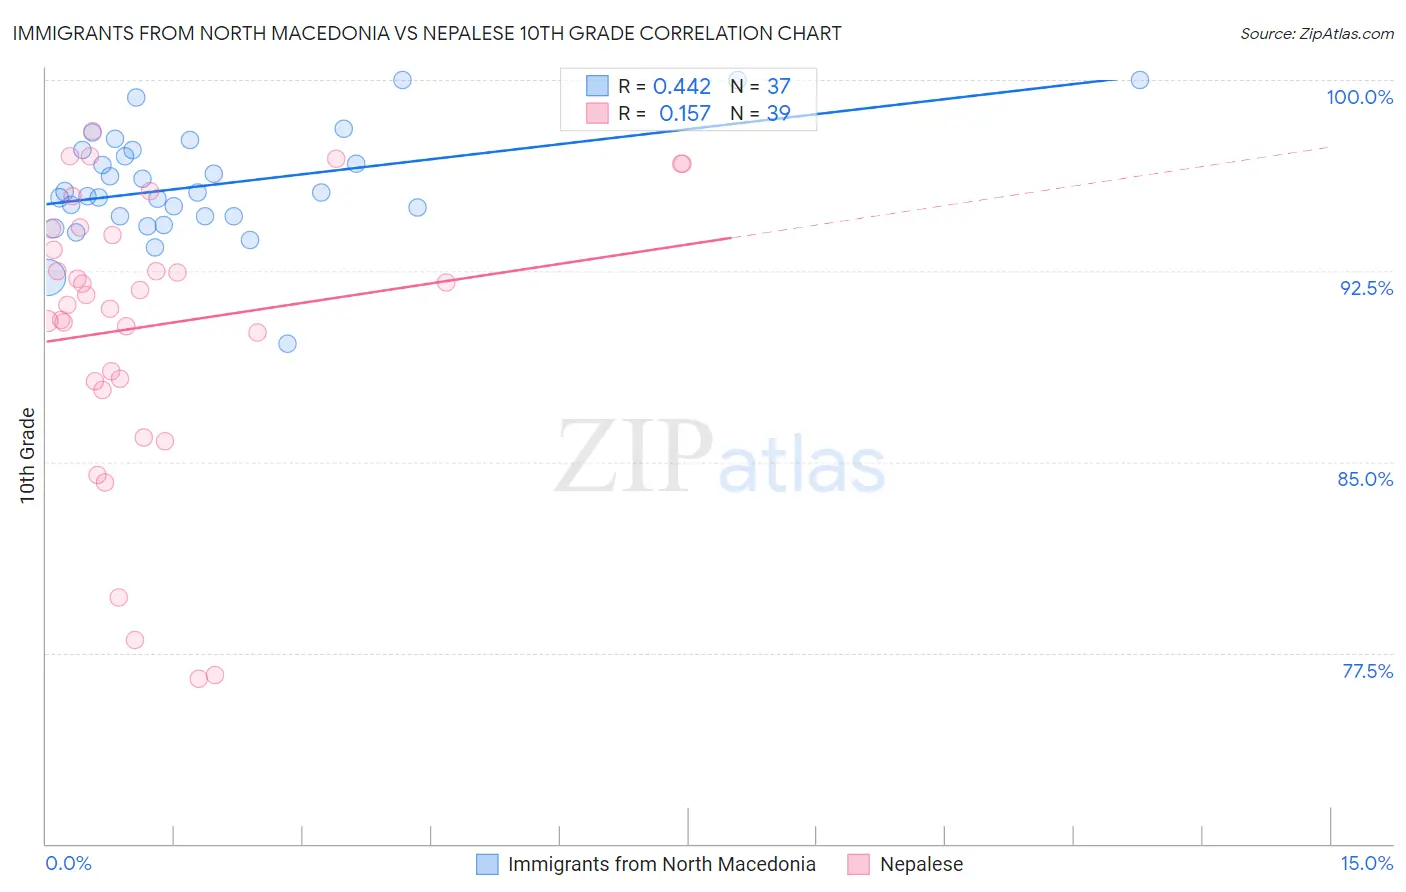
Immigrants from North Macedonia vs Nepalese 10th Grade Correlation Chart
The statistical analysis conducted on geographies consisting of 74,300,344 people shows a moderate positive correlation between the proportion of Immigrants from North Macedonia and percentage of population with at least 10th grade education in the United States with a correlation coefficient (R) of 0.442 and weighted average of 94.5%. Similarly, the statistical analysis conducted on geographies consisting of 24,519,269 people shows a poor positive correlation between the proportion of Nepalese and percentage of population with at least 10th grade education in the United States with a correlation coefficient (R) of 0.157 and weighted average of 90.7%, a difference of 4.2%.
10th Grade Correlation Summary
| Measurement | Immigrants from North Macedonia | Nepalese |
| Minimum | 89.6% | 76.5% |
| Maximum | 100.0% | 98.0% |
| Range | 10.4% | 21.5% |
| Mean | 95.9% | 90.4% |
| Median | 95.6% | 91.5% |
| Interquartile 25% (IQ1) | 94.6% | 88.2% |
| Interquartile 75% (IQ3) | 97.3% | 94.1% |
| Interquartile Range (IQR) | 2.6% | 6.0% |
| Standard Deviation (Sample) | 2.2% | 5.6% |
| Standard Deviation (Population) | 2.1% | 5.5% |
Similar Demographics by 10th Grade
Demographics Similar to Immigrants from North Macedonia by 10th Grade
In terms of 10th grade, the demographic groups most similar to Immigrants from North Macedonia are Immigrants from Norway (94.5%, a difference of 0.0%), Immigrants from Serbia (94.5%, a difference of 0.010%), Immigrants from Croatia (94.5%, a difference of 0.010%), Burmese (94.5%, a difference of 0.010%), and Immigrants from Europe (94.5%, a difference of 0.020%).
| Demographics | Rating | Rank | 10th Grade |
| Syrians | 97.7 /100 | #101 | Exceptional 94.5% |
| Cambodians | 97.6 /100 | #102 | Exceptional 94.5% |
| Immigrants | Europe | 97.5 /100 | #103 | Exceptional 94.5% |
| Immigrants | Romania | 97.5 /100 | #104 | Exceptional 94.5% |
| Immigrants | Turkey | 97.4 /100 | #105 | Exceptional 94.5% |
| Immigrants | Serbia | 97.4 /100 | #106 | Exceptional 94.5% |
| Immigrants | Croatia | 97.4 /100 | #107 | Exceptional 94.5% |
| Immigrants | North Macedonia | 97.2 /100 | #108 | Exceptional 94.5% |
| Immigrants | Norway | 97.2 /100 | #109 | Exceptional 94.5% |
| Burmese | 97.1 /100 | #110 | Exceptional 94.5% |
| Immigrants | Zimbabwe | 96.8 /100 | #111 | Exceptional 94.4% |
| Immigrants | Kuwait | 96.8 /100 | #112 | Exceptional 94.4% |
| Palestinians | 96.5 /100 | #113 | Exceptional 94.4% |
| German Russians | 96.3 /100 | #114 | Exceptional 94.4% |
| Delaware | 96.3 /100 | #115 | Exceptional 94.4% |
Demographics Similar to Nepalese by 10th Grade
In terms of 10th grade, the demographic groups most similar to Nepalese are Cape Verdean (90.8%, a difference of 0.080%), Immigrants from Caribbean (90.6%, a difference of 0.080%), Ecuadorian (90.6%, a difference of 0.090%), Immigrants from Portugal (90.8%, a difference of 0.11%), and Immigrants from Ecuador (90.4%, a difference of 0.26%).
| Demographics | Rating | Rank | 10th Grade |
| Immigrants | Fiji | 0.0 /100 | #307 | Tragic 91.0% |
| Immigrants | Bangladesh | 0.0 /100 | #308 | Tragic 91.0% |
| Immigrants | Immigrants | 0.0 /100 | #309 | Tragic 91.0% |
| Vietnamese | 0.0 /100 | #310 | Tragic 90.9% |
| Immigrants | Cambodia | 0.0 /100 | #311 | Tragic 90.9% |
| Immigrants | Portugal | 0.0 /100 | #312 | Tragic 90.8% |
| Cape Verdeans | 0.0 /100 | #313 | Tragic 90.8% |
| Nepalese | 0.0 /100 | #314 | Tragic 90.7% |
| Immigrants | Caribbean | 0.0 /100 | #315 | Tragic 90.6% |
| Ecuadorians | 0.0 /100 | #316 | Tragic 90.6% |
| Immigrants | Ecuador | 0.0 /100 | #317 | Tragic 90.4% |
| Immigrants | Cuba | 0.0 /100 | #318 | Tragic 90.2% |
| Nicaraguans | 0.0 /100 | #319 | Tragic 90.2% |
| Houma | 0.0 /100 | #320 | Tragic 90.2% |
| Belizeans | 0.0 /100 | #321 | Tragic 90.2% |