Immigrants from North America vs Cherokee No Schooling Completed
COMPARE
Immigrants from North America
Cherokee
No Schooling Completed
No Schooling Completed Comparison
Immigrants from North America
Cherokee
1.6%
NO SCHOOLING COMPLETED
99.8/ 100
METRIC RATING
56th/ 347
METRIC RANK
1.7%
NO SCHOOLING COMPLETED
99.3/ 100
METRIC RATING
76th/ 347
METRIC RANK
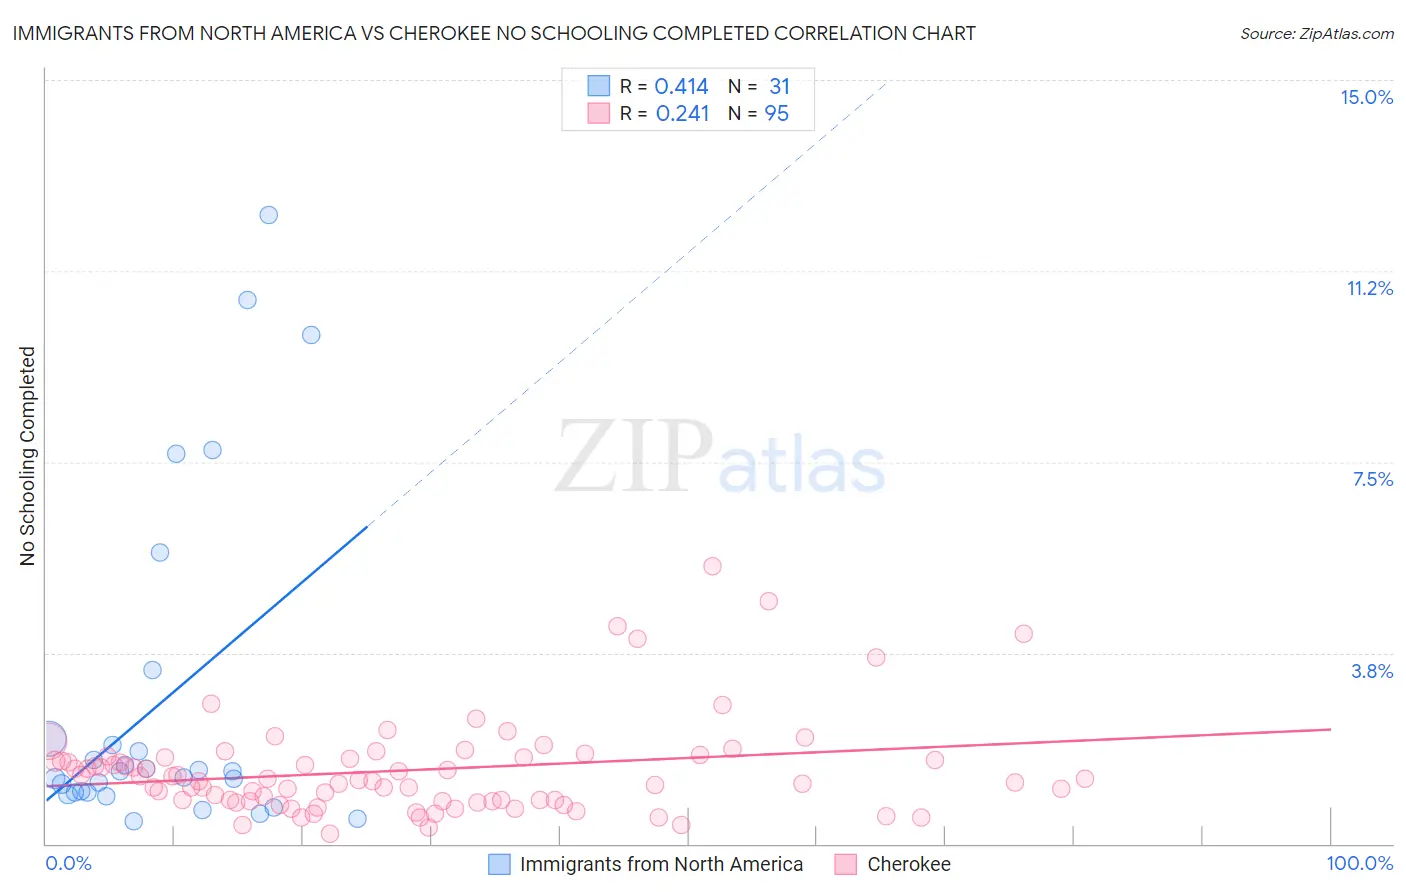
Immigrants from North America vs Cherokee No Schooling Completed Correlation Chart
The statistical analysis conducted on geographies consisting of 454,496,769 people shows a moderate positive correlation between the proportion of Immigrants from North America and percentage of population with no schooling in the United States with a correlation coefficient (R) of 0.414 and weighted average of 1.6%. Similarly, the statistical analysis conducted on geographies consisting of 484,763,957 people shows a weak positive correlation between the proportion of Cherokee and percentage of population with no schooling in the United States with a correlation coefficient (R) of 0.241 and weighted average of 1.7%, a difference of 5.9%.
No Schooling Completed Correlation Summary
| Measurement | Immigrants from North America | Cherokee |
| Minimum | 0.45% | 0.21% |
| Maximum | 12.4% | 5.5% |
| Range | 11.9% | 5.2% |
| Mean | 2.8% | 1.4% |
| Median | 1.4% | 1.3% |
| Interquartile 25% (IQ1) | 1.00% | 0.84% |
| Interquartile 75% (IQ3) | 2.1% | 1.7% |
| Interquartile Range (IQR) | 1.1% | 0.85% |
| Standard Deviation (Sample) | 3.3% | 0.94% |
| Standard Deviation (Population) | 3.3% | 0.94% |
Demographics Similar to Immigrants from North America and Cherokee by No Schooling Completed
In terms of no schooling completed, the demographic groups most similar to Immigrants from North America are Austrian (1.6%, a difference of 0.31%), Kiowa (1.6%, a difference of 0.46%), Slavic (1.7%, a difference of 0.54%), American (1.7%, a difference of 0.66%), and Tsimshian (1.7%, a difference of 0.96%). Similarly, the demographic groups most similar to Cherokee are Immigrants from Belgium (1.7%, a difference of 0.040%), Zimbabwean (1.7%, a difference of 0.63%), Immigrants from India (1.7%, a difference of 0.65%), Cajun (1.7%, a difference of 1.1%), and Immigrants from England (1.7%, a difference of 1.3%).
| Demographics | Rating | Rank | No Schooling Completed |
| Immigrants | North America | 99.8 /100 | #56 | Exceptional 1.6% |
| Austrians | 99.8 /100 | #57 | Exceptional 1.6% |
| Kiowa | 99.8 /100 | #58 | Exceptional 1.6% |
| Slavs | 99.8 /100 | #59 | Exceptional 1.7% |
| Americans | 99.8 /100 | #60 | Exceptional 1.7% |
| Tsimshian | 99.8 /100 | #61 | Exceptional 1.7% |
| Immigrants | Northern Europe | 99.8 /100 | #62 | Exceptional 1.7% |
| Russians | 99.8 /100 | #63 | Exceptional 1.7% |
| New Zealanders | 99.7 /100 | #64 | Exceptional 1.7% |
| Serbians | 99.7 /100 | #65 | Exceptional 1.7% |
| Canadians | 99.7 /100 | #66 | Exceptional 1.7% |
| Immigrants | Austria | 99.7 /100 | #67 | Exceptional 1.7% |
| Immigrants | Lithuania | 99.7 /100 | #68 | Exceptional 1.7% |
| Chickasaw | 99.6 /100 | #69 | Exceptional 1.7% |
| Immigrants | Netherlands | 99.6 /100 | #70 | Exceptional 1.7% |
| Immigrants | England | 99.5 /100 | #71 | Exceptional 1.7% |
| Cajuns | 99.5 /100 | #72 | Exceptional 1.7% |
| Immigrants | India | 99.4 /100 | #73 | Exceptional 1.7% |
| Zimbabweans | 99.4 /100 | #74 | Exceptional 1.7% |
| Immigrants | Belgium | 99.3 /100 | #75 | Exceptional 1.7% |
| Cherokee | 99.3 /100 | #76 | Exceptional 1.7% |